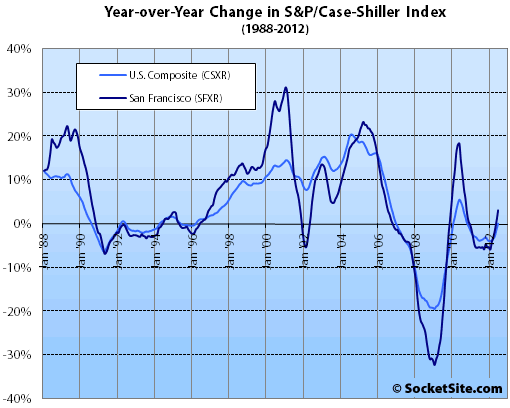
According to the June 2012 S&P/Case-Shiller Home Price Index, single-family home prices in the San Francisco MSA gained 2.8% from May 2012 to June 2012, up 3.0% year-over-year (YOY) but remains 36.3% below a May 2006 peak.
For the broader 10-City composite (CSXR), home values gained 2.2% from May to June, up 0.1% year-over-year, the first YOY gain in twenty (20) months but 31.5% below a June 2006 peak.
Only two cities – Charlotte and Dallas – saw annual rates of change worsen in June. The other 18 cities and both composites saw improvement in this statistic, and 13 of these had a positive trend. There were only six cities – Atlanta, Chicago, Las Vegas, Los Angeles, New York and San Diego – where the annual rates of change were still negative. Boston’s annual rate was flat. We seem to be witnessing exactly what we needed for a sustained recovery; monthly increases coupled with improving annual rates of change. The market may have finally turned around.
The regions showed positive results for June. All 20 of the cities saw average home prices rise in June over May and all were by at least 1.0%. Detroit was up the most, +6.0%, and Charlotte the least, +1.0%. The Composites showed the same increases as last month – the 10-City rose by 2.2% in June and the 20-City by 2.3%. We are aware that we are in the middle of a seasonal buying period, but the combined positive news coming from both monthly and annual rates of change in home prices bode well for the housing market.
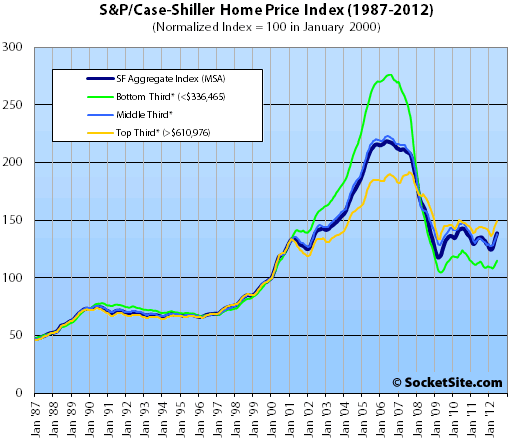
On a month-over-month basis, prices increased across all three San Francisco price tiers.

The bottom third (under $336,465 at the time of acquisition) gained 2.3% from May to June (up 1.5% YOY); the middle third gained 2.0% from May to June (up 2.4% YOY); and the top third (over $610,976 at the time of acquisition) gained 1.3% from May to June, up 3.7% year-over-year (versus 2.6% in May).
According to the Index, single-family home values for the bottom third of the market in the San Francisco MSA are back to July 2000 levels (58% below an August 2006 peak), the middle third is back to May 2002 levels (38% below a May 2006 peak), and the top third is back to April 2004 levels (22% below an August 2007 peak).
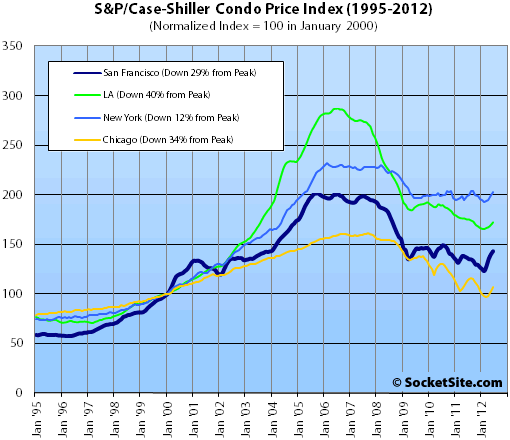
Condo values in the San Francisco MSA gained 2.3% from May to June, up 4.8% year-over-year but still 28.9% below from a December 2005 peak.

Our standard SocketSite S&P/Case-Shiller footnote: The S&P/Case-Shiller home price indices include San Francisco, San Mateo, Marin, Contra Costa, and Alameda in the “San Francisco” index (i.e., greater MSA) and are imperfect in factoring out changes in property values due to improvements versus appreciation (although they try their best).
∙ S&P/Case-Shiller: Home Prices Rose in the Second Quarter of 2012 [Standard & Poor’s]
∙ Case-Shiller San Francisco: First Year-Over-Year Gain In 18 Months [SocketSite]
I expect the market to cool off sometime in the next year. We still have more debt and pain to work through in the global economy. Over the short term though I think we will see the CSI continue to rise. I’ll be curious to see if the middle tier gets back to 150 and I think there is a decent change that will happen, but I doubt the lower tier will get there before prices start falling again.
Prestige Index is up (and up) too:
http://www.firstrepublic.com/lend/residential/prestigeindex/sanfrancisco.html
Up 2.9% QOQ and 6.6% YOY. It’s between Q4 2004 and Q1 2005 without adjusting for inflation. It’s about 1.7% below Q2 of 2003, 1.2% below Q1 of 2002, and 3.4% above Q2 of 2000, when adjusted for inflation.
It’s hard to say that Case-Shiller overall has been anything other than relatively flat for the last few years, even with lots of government subsidies and extremely cheap loans.
It looks like the SF composite is up 14% since it bottomed out in spring of ’09. I think it’s safe to say next month should also show a gain given the lag in this index.
So, fell about 40% from peak – 50% adjusted for inflation – and it’s made up about 3% in the last year, just about keeping up with inflation. There’s the ON FIRE local real estate market for you.
Funny thing is I think back to the early days of 09 when the bears were confidently screeching that we were “NOWHERE NEAR THE BOTTOM”!!!!
I look back on those calls and just laugh and laugh and laugh…
Why is the seasonal component so much more dramatic in the past ten years, particularly in the SF MSA? Chicago in the past 5 years also shows an exaggerated seasonal wiggle.