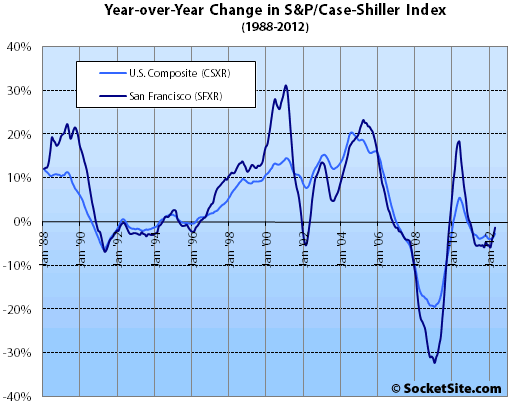
According to the April 2012 S&P/Case-Shiller Home Price Index, single-family home prices in the San Francisco MSA rose 3.4% from March 2012 to April 2012, down 1.4% year-over-year, down 40.4% from a peak in May 2006.
For the broader 10-City composite (CSXR), home values rose 1.2% from March to April, down 2.7% year-over-year, down 34.4% from a June 2006 peak.
On a monthly basis, 19 of the 20 MSAs and both Composites rose in April over March. Detroit was the only city that saw prices fall, down 3.6%. In addition, 18 of the 20 MSAs and both Composites saw better annual rates of return. It has been a long time since we enjoyed such broadbased gains. While one month does not make a trend, particularly during seasonally strong buying months, the combination of rising positive monthly index levels and improving annual returns is a good sign.
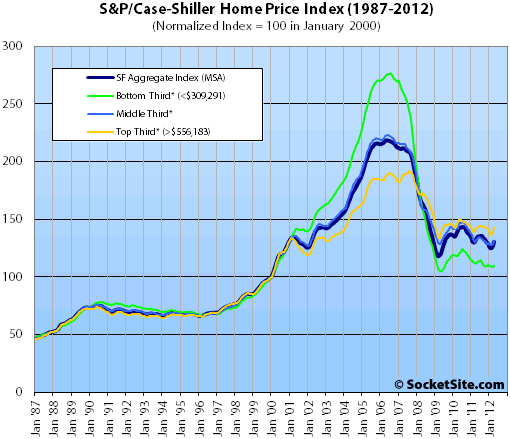
On a month-over-month basis, prices rose across all three San Francisco price tiers.

The bottom third (under $309,291 at the time of acquisition) gained 1.3% from March to April (down 1.6% YOY); the middle third gained 2.1% from March to April (down 0.8% YOY); and the top third (over $556,183 at the time of acquisition) gained 3.1% from March to April, up 0.5% year-over-year, the first YOY gain in seventeen months.
According to the Index, single-family home values for the bottom third of the market in the San Francisco MSA are back to April 2000 levels having fallen 60% from a peak in August 2006, the middle third is back to February 2002 levels having fallen 41% from a peak in May 2006, and the top third is back to January 2004 levels having fallen 25% from a peak in August 2007.
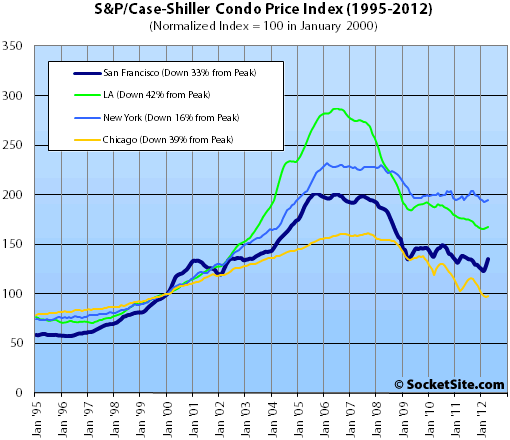
Condo values in the San Francisco MSA jumped 5.5% from March to April but remain down 2.2% year-over-year, down 32.8% from a December 2005 peak.

Our standard SocketSite S&P/Case-Shiller footnote: The S&P/Case-Shiller home price indices include San Francisco, San Mateo, Marin, Contra Costa, and Alameda in the “San Francisco” index (i.e., greater MSA) and are imperfect in factoring out changes in property values due to improvements versus appreciation (although they try their best).
∙ S&P/Case-Shiller: Home Prices Rise in April 2012 [Standard & Poor’s]
∙ S&P/Case-Shiller San Francisco: Condo Prices Jumped In March [SocketSite]
The price of condos has increased by 10% in the past 2 months….Crazy, crazy..
If things go on like this for a year or two, I might turn my coat back to the bear side.
Then again in 2 years I’ll probably be an entitled hypocrite making donations to the Howard Jarvis association!
And yet, condo prices are still 2.2% below a year ago!
Last comment (12.24) was not me.
But I guess imitation is the highest form of flattery.
Thanks.
I must have a really crappy condo, zillow keeps lowering my estimate.
Odd grumpy, everything in my neighborhood is just fine and has been for years
funny, most neighborhoods took some sort of hit during and continued recession. why do you suppose yours has been immune?
funny, most neighborhoods took some sort of hit during and continued recession. why do you suppose yours has been immune?
Interesting, talked to some friends of mine and they say their neighborhoods are all fine too
Yea, I agree. Noe Valley is doing just fine.
How do you guys pull in / calculate the cutoff for the top tier? ($556k in this month). I would like to pull that in historically.
Thanks!
I believe all you need to do is look at the total counts and split the full set in 3 equal parts (thirds).
If you have 600 sales, 1st third will be 1-to-200, 2nd third will be 201-400, 3rd third will be 401-600.
Thanks lol – but i think you misunderstood my question. What i was asking was where the $556k number comes from, and where i can pull in that cutoff house value number historically (the cutoff would fluctuate according to house prices)
Interesting, talked to some friends of mine and they say their neighborhoods are all fine too
When did your neighbors buy?
http://ms.cc.sunysb.edu/~hbenitezsilv/housing08.pdf
“Our results show that homeowners, on average, overestimate the value of their properties by between 6% and 10%. […] While most individuals overestimate the value of their properties, individuals who bought during more difficult economic times tend to be more accurate, and in some cases even underestimate the value of their houses. We find a strong correlation between accuracy and the economic conditions.”
“question”,
The Case Shiller website has Excel formatted spreadsheets.
http://www.standardandpoors.com/indices/sp-case-shiller-home-price-indices/en/us/?indexId=spusa-cashpidff–p-us—-
For Tiers, look for the detail on “Home Price Tiered Index Levels”
Knock yourself out…
Just be aware that tiers depend on mix. Say theoretically if you had foreclosures on 1/2 the sales, that will greatly influence the tier number. Same thing if the only thing that sells is high end.