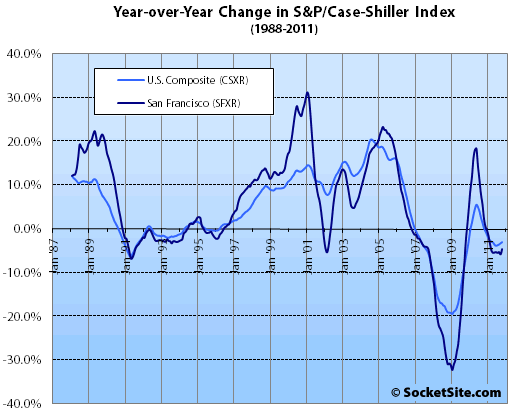
According to the October 2011 S&P/Case-Shiller Home Price Index, single-family home prices in the San Francisco MSA fell 0.7% from September ’11 to October ’11, down 4.7% year-over-year (versus a 5.9% YoY drop in September), down 39.4% from a peak in May 2006.
For the broader 10-City composite (CSXR), home values fell 1.0% from September to October, down 3.0% year-over-year and down 31.9% from a June 2006 peak.
Atlanta and the Midwest are regions that really stand out in terms of recent relative weakness. Atlanta was down 5.0% over the month, after having fallen by 5.9% in September. It also has the weakest annual return, down 11.7%. Chicago, Cleveland Detroit and Minneapolis all posted monthly declines of 1.0% or more in October. These markets were some of the strongest during the spring/summer buying season. However, Detroit is the healthiest when viewed on an annual basis. It is up 2.5% versus October 2010. Atlanta, Cleveland, Detroit and Las Vegas are four markets where average prices are below their January 2000 levels; and Atlanta and Las Vegas posted new lows in October.
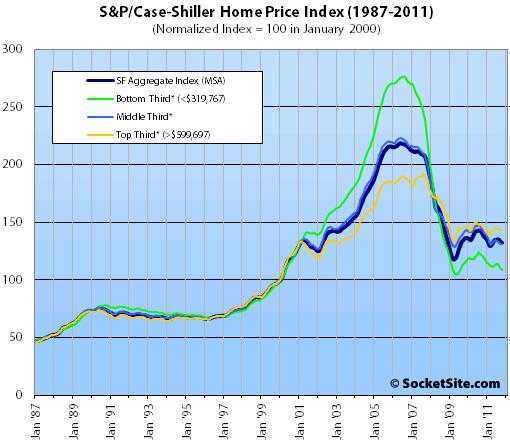
On a month-over-month basis, prices fell for the bottom third of San Francisco MSA price tiers, pushed for the middle, and nominally increased for the top third.

The bottom third (under $319,767 at the time of acquisition) fell 0.9% from September to October (down 9.1% YOY); the middle third was unchanged from September to October (down 8.1% YOY); and the top third (over $599,697 at the time of acquisition) rose 0.3% from September to October, down 1.6% year-over-year (versus down 3.1% in September).
According to the Index, single-family home values for the bottom third of the market in the San Francisco MSA have dropped below May 2000 levels having fallen 60% from a peak in August 2006, the middle third has dropped below March 2002 levels having fallen 41% from a peak in May 2006, and the top third has dropped below February 2004 levels having fallen 25% from a peak in August 2007.
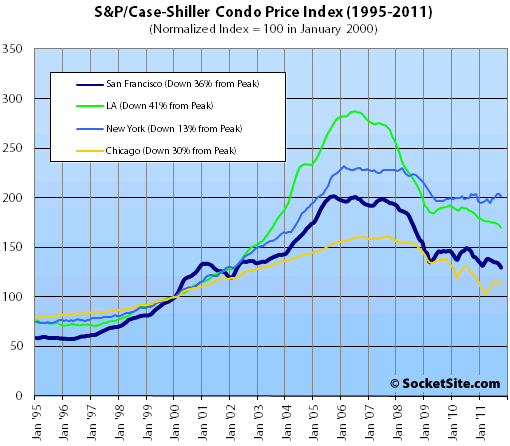
Condo values in the San Francisco MSA fell 2.6% from September ’11 to October ’11, down 8.0% year-over-year, down 35.6% from a December 2005 peak.

Our standard SocketSite S&P/Case-Shiller footnote: The S&P/Case-Shiller home price indices include San Francisco, San Mateo, Marin, Contra Costa, and Alameda in the “San Francisco” index (i.e., greater MSA) and are imperfect in factoring out changes in property values due to improvements versus appreciation (although they try their best).
∙ S&P/Case-Shiller: Fourth Quarter Starts with Broad-based Declines [Standard & Poor’s]
∙ S&P/Case-Shiller San Francisco: Prices Fell In September [SocketSite]
Great charts as always. SF top tier is stubbornly keeping roughly 2 years of its 2002-2007 bubble gains, while the lower tier has given it all back, like most other cities.
Very reflective of a city that is splitting in 2: people who are connected to the world’s growth and others connected to the overall US situation. Government is downsizing, some big financial firms are doing drastic cuts to stay open. In the mean time a very healthy tech sector brings new and wealthy blood to this City. We’re still pretty lucky I think, with a shrinking unemployment and rent-vs-own numbers that make more sense.
The bubble has burst. Now if we could have more growth in the country that would be nice…
I find it interesting that the 3 tiers are all in step from 87-01 where things start to go off course. The lower tier still has not found any sense of solid ground but the top and middle seem to be moving more in lock step.
I don’t even try to follow the condo market outside of the 2500+ sqft SFH replacement option. Still too much volatility.
^^^ remember this is SF Metro, not SF County. The sub-319K market in SF County is very limited. Either very poor quality housing, or distressed area, or tiny property.
Decent homes in SF proper are still very much in demand. A rule of thumb in a massive correction would have been that most people left out of decent housing during the bubble years should be given a chance today. This is true for the lower tier, but not SF proper. It sucks for many reasons, mostly for social and cultural diversity, but this is a reality. The middle class is slowly being squeezed out and the lower class has little room aside from subsidies of all sorts (social housing, rent control from leases way back).
The tiers are the price at the time of purchase. There are many, many sub-319k homes in SF by that relevant measure. And a lot more in the middle tier (under $600k) by that measure. Heck, even if you use today’s selling prices, pretty close to half of SF homes are selling in the lower two tiers.
The argument that “SF is way different from its neighboring counties including SF” is simply false.
A.T. please do not say this is false. Nothing is clean-cut in any market. Almost everything is debatable. Your opinion is that prime SF is the same as say Oakland or Daly. My opinion is that it is not when looked with a 2X magnifier glass. There are connections between all close markets but that doesn’t make them the same. There are families that will move to the EB for affordability, others that will move to Marin for better schools. But overall we live in a pretty fantastic City (otherwise why pester about high prices? There are many many nice and cheap areas in Northern CA today). We do attract some of the best and brightest and that puts us in a different market.
lol, you’re now comparing “prime SF” (whatever that is, maybe the best performing 10% of SF?) with two particularly weak parts of the bay area. This is the argument that a number of realtors make here — if you consider only the very highest performing segment of the market and exclude everything else, the result is that . . . you get good results.
I agree that everything is not clean-cut and I did not say that every single area or property in the bay area has dropped (or held up) equally. All I said is that SF (all of SF) is not much different from all of the CSI area. Every town will have better performing areas or properties and worse performing areas.
Here is a good illustration — closed on 12/23:
http://www.redfin.com/CA/San-Francisco/2963-23rd-Ave-94132/home/1793748
Decent place, nice area. A “top tier” place in SF that just sold for a bit below its May 2000 price. Yep, it’s still more expensive than a comparable house in Concord. But it was in 2000 as well. And it is right there with the worst-performing segment of the area CSI. SF is not “different” but is subject to exactly the same market forces as its neighbors in a 25 mile radius.
CSI top tier has fallen 25%. Middle tier has fallen 41%. That is precisely the range of declines that I’ve been saying SF in general has experienced. so I will agree that SF is generally within those two less-bad ranges.
That 23rd st place was an REO that had been stripped, which indicates that it likely only had a larger pest report from its 2000 13K report. So no apple there. It’s very lame that none of your redfin links can be taken at the value you insert, AT. But you only brought that on yourself.
stripped? Of what? 15 year old appliances worth about $100 on the open market? The kitchen is going to be torn out and redone and the “strip” saves the buyer the trouble of hauling the appliances to the dump.
Nice try dude, you’re really reaching. Stripped 15 year old appliances. Wow.
Somehow staged in 2000 versus stripped in 2011 has yielded a “reach” comment? Somehow the sum of the missing appliance and fixture parts is the calculation, and somehow the average buyer is doing that math instead of overall feel and look? No, I doubt you believe those notions.
Don’t forget the 32% inflation since May 2000 that I didn’t even mention. Perhaps the appliances were not your standard couple of thousand dollars new at best but were sold platinum, and thus we have no loss at all!
Yes, Tipster, anon.ed is right. The appliances were VINTAGE and worth even more than they were 11 years ago.
Rich foreigners would have paid top dollar for them, only if they could get them fee simple.
[sarcasm] Yes, that’s right. Tabulate the missing appliances and there you have it. That’s precisely how to view something like this. Also, staged reads/performs the exact same as stripped with buyers. Third, 11 years beginning with a $13,500 pest report is the very same thing as a typical 4 year peak to trough “apple,” which was essentially new last at last sale. Last, semi fixers will do just as well as new remodels in the western parts of town nowadays. [/sarcasm] (I decided to ignore your two forced flames this time, Tippy. Happy New Year.)