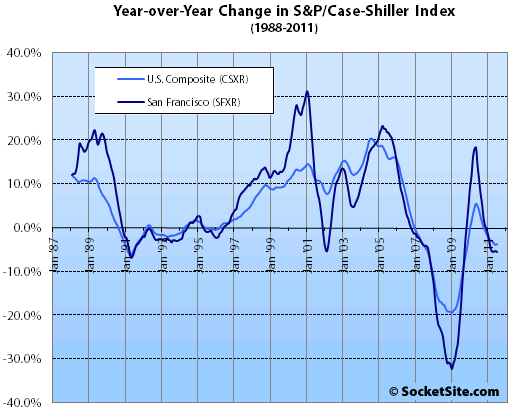
According to the July 2011 S&P/Case-Shiller Home Price Index, single-family home prices in the San Francisco MSA increased a nominal 0.3% from June ’11 to July ’11 but remain down 5.6% year-over-year (YOY), the seventh consecutive month of year-over-year declines, down 38.1% from a peak in May 2006.
For the broader 10-City composite (CSXR), home values increased 0.9% from June to July but remain down 3.7% year-over-year, down 31.0% from a June 2006 peak.
“With July’s data we are seeing not only anticipated monthly increases, but some fairly broad improvement in the annual rates of change in home prices,” says David M. Blitzer, Chairman of the Index Committee at S&P Indices. “This is still a seasonal period of stronger demand for houses, so monthly price increases are expected and were seen in 17 of the 20 cities. The exceptions were Las Vegas and Phoenix where prices fell, while Denver was flat. The better news is that 14 of 20 cities and both Composites saw their annual rates of change improve in July.”
“While we have now seen four consecutive months of generally increasing prices, we do know that we are still far from a sustained recovery. Eighteen of the 20 cities and both Composites are showing that home prices are still below where they were a year ago. The 10-City Composite is down 3.7% and the 20-City is down 4.1% compared to July 2010. Continued increases in home prices through the end of the year and better annual results must materialize before we can confirm a housing market recovery.”
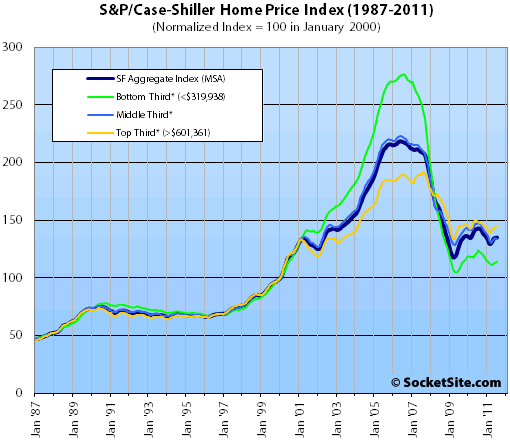
On a month-over-month basis, prices rose across the top and bottom San Francisco MSA price tiers, falling in the middle. On a year-over-year basis, however, values remained down across all three tiers.

The bottom third (under $319,938 at the time of acquisition) increased 0.8% from June to July (down 7.9% YOY); the middle third fell 1.0% from June to July (down 10.1% YOY); and the top third (over $601,361 at the time of acquisition) ticked up 0.5% from June to July but remains down 2.9% year-over-year.
According to the Index, single-family home values for the bottom third of the market in the San Francisco MSA have returned to June 2000 levels having fallen 59% from a peak in August 2006, the middle third remains just below April 2002 levels having fallen 40% from a peak in May 2006, and the top third remains at February 2004 levels having fallen 25% from a peak in August 2007.
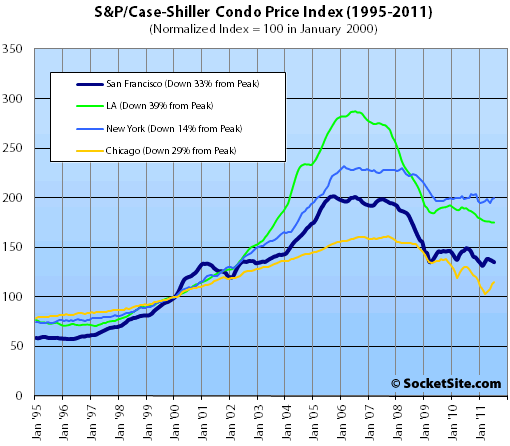
Condo values in the San Francisco MSA fell 1.1% from June ’11 to July ’11, down 9.4% year-over-year versus a 6.8% YoY drop in July, down 32.9% from a December 2005 peak.

Our standard SocketSite S&P/Case-Shiller footnote: The S&P/Case-Shiller home price indices include San Francisco, San Mateo, Marin, Contra Costa, and Alameda in the “San Francisco” index (i.e., greater MSA) and are imperfect in factoring out changes in property values due to improvements versus appreciation (although they try their best).
∙ S&P/Case-Shiller: Home Prices Continue to Show Seasonal Strength [Standard & Poor’s]
∙ S&P/Case-Shiller San Francisco: SFH’s Tick Up, Condos Down In June [SocketSite]
My, how resigned we’ve become! A 5.6% YOY decline is right in line with the steepest drops of the early 90s recession, but when that is on top of prior 30% declines it seems to get lost in the fog.
Seems like people are resigned about MSA versus SF, true. Nobody talks in these threads any more because the discrepancy is obvious old hat.
5 years after the bubble popped and prices are still going down (year over year).
hurry up already. i haven’t got all day.
I agree; hurry up already. I work in biotech. My s.o. is a nurse. I should able to buy a nice place to live in a nice neigboorhod…right?!!
I think the lack of chatter has more to do with resignation that prices in SF have fallen, it’s not just media “scare tactics”, there is less need to debate.
What’s the definition of insanity again? Same people, same opinions, skewed facts / perspectives. Really, how many times can we have the same conversation.
There’s less chatter because these graphs keep bringing hope and change to prospective buyers, making them think, “yes, we can!” and then they go out into the real world and find the graphs don’t translate into lower prices for single family houses in Pac Hgts, Marina, Russian Hill etc.
Oh it has translated into lower prices, just not affordable or low prices in those neighborhoods yet. 80% of bubble pricing in those neighborhoods is still a lot of money.
I think you will find that even after years of declining real estate prices, that the prime neighborhoods in Tokyo are still rather expensive. I don’t think you will see prime SF real estate coming into reach of those earning mid-range salaries or not inheriting large sums of money.
Clearly, the SF price spike was the result of a spike of inheritances. It had nothing to do with the concurrent, credit bubble experienced in other parts of the country.
Yeah, there was some bubbly effect in SF, but by the time it started hitting we got lucky enough to be struck by yet another Gold Rush.
Not that much luck for bargain hunters though. SF is becoming more and more a city for the affluent, as are all other globally attractive cities.
SFRs in D7 represent less than 1% of the bay area, which is what this index covers. In other words, aside from entertainment value, it doesn’t really matter if some absentee billionaire’s empty mansion fell 10% or 40%. We live in a city with a median home price of $620K.
The key to avoid having the same “MSA versus SF” conversation would be for someone to pony up the money to license the S&P/Case-Shiller methodology, start an independent organization, perhaps based at one of our local, fine institutions of higher education, to apply it just to San Francisco proper and then on an ongoing basis, gather and release resulting data.
Since there’s no money in doing that, it won’t be done and S.F. real estate bulls can go on making arguments taking advantage of the fact that the Case-Shiller data isn’t granular enough for ever and ever, amen.
“The key to avoid having the same “MSA versus SF” conversation”
Not that I expect people with a propensity for unreasonable arguments to suddenly become reasonable or vice versa. But it does seem like two interesting facets regarding if and/or how SF will decouple from the MSA are.
1) Data showing that this is or isn’t in fact happening. (i.e. apples, sf prestige index,Zillow & Redfin indicies,…)
2) Trends, forecasts or anecdotes relating to what might happen in the future. ( i.e. tech is bullish for SF but also hardly unique to SF proper, younger tech workers may leave the city once kids are in the picture, high end tech money may support luxury homes,…)
The last few months of CS have been small and noisy and so don’t seem to me to say anything one way or the other in terms of Data (#1) And I don’t see any story here relating to #2.
Yes, this is just the SF MSA, not Contra Costa proper. Here in Contra Costa County, prices are booming! (you have no CSI data saying otherwise, and the absence of incontrovertible contrary data means that I am necessarily right). SF has crummy weather, too many homeless, and poor schools, so it’s logical that people would continue to move here, and that is why prices are climbing here and falling in SF.
I have said it in the past. You can still buy a nice house in Brentwood for not much over $100/sf and take the rest of the money and buy a small condo in the City so you don’t have to commute. Or you can just buy a nice house in Danville for $350/sf
and ride BART. Your kids will thank you.
Two views:
Renters: Fundamentals point clearly to further drops; prices are down 30-40% in SF and will drop another 50% imminently. Pac Heights mansion for a million within a year.
Owners and Brokers: Prices are up in the real SF and anything showing otherwise, we will say had special circumstances (last buyer overpaid, busy street, not the real SF, special circumstances which only r/e pros in the know would understand).
Again, what about the in between view. We’ll go sideways lower, up and down but in a slow leak over a period of years. Painfully slow correction for both buyers and sellers. Imbalances exist but the forced selling doesn’t exist in the real SF en masse so it will take a long time. And in the meantime, cash buyers will still grab unique properties in the –i don’t need a mortgage– category and this will give the bulls hope.
^Perhaps, but it’s different when numbers start getting utilized. The Case Shiller report shows a 5.6 % YoY SFR drop. Does anyone really think that San Francisco would show such a result beween 2010 and 2011 so far, given the tech 3.0 spring that it experienced? Especially with regard to SFRs? Case Shiller is too broad for discussing the local market, period, and everybody knows that fact. Bear, bull, whatever.
CSI is a composite – true. But one cannot point to sales of a handful of very nice homes in Noe Valley or Pac Heights and conclude that “SF is totally different.” As I have noted, Noe Valley and “San Francisco” are not synonymous.
Here is one example of a place that I assume would go into CS’s numbers:
http://www.redfin.com/CA/San-Francisco/1251-14th-Ave-94122/home/1279268
SFR in the inner sunset that just sold at a 36.5% discount off its 2004 sale price – way below the CSI average for the SF MSA (which shows a 22% discount — and this home is CS top tier by the way). While it is certainly true that some SF homes have done better than CSI, many have done worse (like this one) – same could doubtless be said for homes in Marin, Contra Costa, and Alameda. I’ve never seen any meaningful numbers indicating that “SF” has done much better than its neighboring counties and SF combined over the bubble bust years. I’d accept that SF has probably done a bit better than CSI as a whole. We can debate the impact of dot-com 3.0, but one cannot seriously argue that this impact is not spread among the counties that comprise the CS MSA.
and conclude that “SF is totally different.”
Scare quotes. Handful of sales. “Noe Valley or Pacific Heights.” Yawn. I said YoY, SF. Questioning the 5.6% displayed atop the thread.
Grow up. First a mild troll exercise, then trolling into overdrive with the Tipster-as-realtor bite, then “specific case within city as trend even though I’m arguing against those who would use a city as trend.”
yawn.
^ I’m not sure what you’re saying here.
But I’d agree with A.T. that given how tech is spread all over the region and hardly unique or even centered in SF, it does not seem certain that even if a tech boom happened it would cause SF to significantly break away from the broader MSA. Not saying it couldn’t happen, but it doesn’t seem reasonable to assume that absent any evidence.
Dataquick’s August numbers show SF’s median price down 5.2%, YOY. Pretty close.
[Editor’s Note: Recorded Sales Activity Up 7.3% In August As The Median Drops.]
Legacy Dude, don’t try to sway us with all your facts and evidence.
Everyone knows that unfounded presumptions, rhetorical questions, and summarily stating what “everybody knows” are far more compelling.
AT, how many voices are you going to use in one thread? Take it easy, dude. “Median” now. You lot seizing upon it. LOL.
No index is perfect at capturing every nuance of a market – every metric is flawed in some way. But they’re still useful proxies to track, especially when it comes to interpreting broader trends. We’re all aware of the flaws of the respective indices; I think they’re generally accurate although obviously not precise.
Besides, had DQ or S&P shown a 5% jump, this thread would have started with 10 postings from bored realtors and underwater investors trolling about how prices were supposed to go to zero, where are the stupid bears who predicted the entire Marina would be foreclosed on, and assorted other playground games. Keen insights like, “Neighborhood X is still expensive!”
So either these gauges work both up and down, or they don’t work at all. Which is it? And if the latter, what’s a better gauge?
go back to the left side of the graph, take the slope of the price curve and extrapolate to the right – that should get you the expected price within a decent range; of course, you’d have to do this on a comparative basis.
I wonder who is buying these houses? Are there that many rich people in SF? There are a lot of shadow inventory left so prices are bound to drop further hopefully.