As we wrote in July:
Purchased for $1,410,000 in August 2002, 636 28th Street sold for $1,600,000 in January 2005 (effective annual appreciation of 6% per year from 2002 to 2005) and then sold for $2,100,000 in March 2007 (effective annual appreciation of 13% per year from 2005 to 2007).
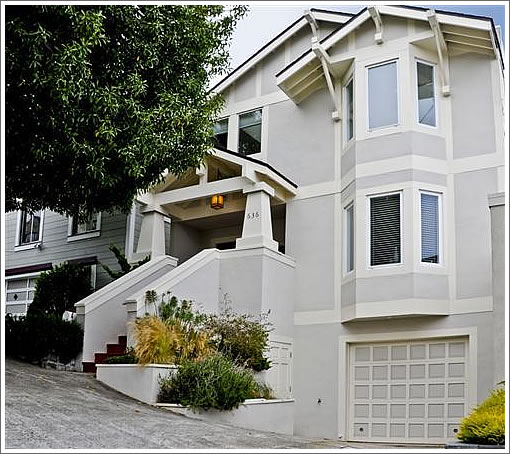
The Noe Valley four bedroom is back on the market today and asking $1,895,000 ($673 per square foot), a sale at which would represent effective annual depreciation of 3% per year from 2007 to 2010 (a drop of 11%).
The sale of 636 28th Street closed escrow yesterday with a reported contract price of $1,875,000, an eleven (11) percent drop below its 2007 value (but 17 percent above 2005).
∙ A Bounty Of New Noe Valley Apples (And Summer Inventory) [SocketSite]
Thanks to Socketsite for providing some context. Here’s a bit more. 2005 saw 174 SFR sales in Noe, averaging $760 psqft. 2007 saw 115 sales, averaging $826 psqft.
Sold @ asking and a good comp data point. And although down from 2007 like most everything, this is a pretty solid outcome overall. Congrats to all involved. Probably would have sold for over asking if interest rates didn’t go up! 😉
So if anything, the buyer UNDERPAID in 2007 because $826/sqft would be $2.3M+?
$1.40M in 2002 is equivalent to about $1.70M today. That means $1.875M is 1.2% real appreciation since 2002, which sounds about right.
It’s all micro 🙂 The 28th street Noe comps were always lower than the 23rd-25th street comps.
Buyers rely on per sqft data at their own peril.
“So if anything, the buyer UNDERPAID in 2007 because $826/sqft would be $2.3M+?”
Looking at it that way, they underpaid/ the property underperformed in both 2005 and 2007. I think my point was that a 2 year 26.5% gain was not in keeping with what the market was doing.
[anon.ed]
Look into your crystal ball. What does the it say for $/sq.ft. in 2011? Very curious to see what type of pricing rings in the new year.
Lost “only” $225,000 plus another ~$100,000 in selling costs. In 3 1/2 years (and I’m not even counting the sizable own vs. rent losses). This is now what passes for “a pretty solid outcome.” Yet that is a decent-sized fortune flushed down the toilet. We’re clearly in the age of diminished expectations!
It’s all micro 🙂 The 28th street Noe comps were always lower than the 23rd-25th street comps
True.
Look into your crystal ball. What does the it say for $/sq.ft. in 2011?
I don’t have a crystal ball.
Very curious to see what type of pricing rings in the new year
So am I. If you want to talk to me about thest things in earnest, I know you know how to reach me. This is not the format.
“Probably would have sold for over asking if interest rates didn’t go up! ;)”
You have to look at when the property went contingent. Properties that went contingent before December 1 used lower interest rates to allow for higher purchase prices and properties that went contingent after December 1 have markedly different purchase prices, because that’s when interest rates really took off.
This property went contingent well before December 1, so it was likely unaffected by the higher interest rates.
if a $2 million home is truly your price point a $225,000 hit to your assets is not going to hurt very much.you probably lost more in the 2008 securites market decline . it’s not pleasant but it’s nothing like the people out in brentwood or antioch who ended up in forclosure.
so you drive the XKR,M6 or carrera a little longer and the vacations aren’t that nice for a few years. junior is still in the $20,000/yr private school.
^^^ Haha, the old “pocket change” argument. I thought that one died long ago.
what @ 12:38 – a $225K loss on $2M isn’t bad, I guess, if you had the $2M in the first place. If you financed it, though, that’s a > 50% loss on 20% down, not to mention your transaction costs of at least $120K (assuming 6% commission). I would guess the sellers put more than that down, but you never know – could have actually been less!
i’m pretty conservative and don’t think you should by more primary residence than you can afford.if you truly can afford a $2 million home either through income or assets that’s not much of a loss.
Metro area san francisco
Top 5%
Average household income $456,008
Metro area francisco top- 20%
Average household income $257,399
http://articles.moneycentral.msn.com/SavingandDebt/LearnToBudget/how-to-know-if-youre-rich-in-your-city.aspx
@what — The issue is that most people stretched quite a bit to get their house during the boom. $2m might be their price point, but not really a level sustainable by their assets/income.
There are surely some extremely wealthy all cash buyers, but it didn’t seem absurd(to some people) during the boom to stretch 10x income to buy a house. So you get a couple with 200k income into a $2M house.
The “I’m not Rich” Chicago Law Professor (Henderson?) seems like an example of this $250k+ household income ~$1.5M house. Very little free cash flow. Lots of debt.
Anecdotally, I know a lot of “house poor” people like this. Plus, if you google around a bit you can find zip code based data on %DP, homeowners equity and % of stated/NINA loans.
@what — From your link:
We started with data on mean household income, by quintile, from the Census Bureau’s American Community Survey for 2007. Where possible, we used data for metropolitan statistical areas, which represents more people than for the urban areas at the core of each MSA.
Mean income is not that great a tool for looking at housing affordability due to the fact that a few extremely high earners ( i.e. $100’s of milllions) can seriously distort the mean. Especially when you average over a smaller group like the top 5% of earners.
Imagine if you lived in a town with 999 doctors making $100k and Larry Elison making $100M. The mean income is $199k even though only 0.1% of people make over that amount.
i am not disagreeing .
i prefaced my original comment by saying “IF a $2 million home is TRULY your price point” perhaps i should have said “if you did not by a house beyound the 4-5x income limit then your income should allow you to weather an 11% drop in home value.”
i admit i have a hard time understanding buying a home 10X your salary or using some of the riskier loan products
Hmmm… sold for more than its 2005 price? That’s impossible! Impossible I tell you, prices are now down to below 2001!
“sold for more than its 2005 price?”
That it did, and on that basis is was a relatively strong showing. Of course, in this market, relatively strong just means less devastating. As I’ve said before, all we have in SF are degrees of bad.
(and once again, if it weren’t for that inconvenient 2007 sale, we’d have crowds here pointing out that Noe is strong because the 2010 sale is higher than 2005 and NO WAY would this place have ever gone for more than $2 million in 2007)
Speaking of knowing your neighbor(hood), the NY Times has done a very cool mashup of census bureau ACS data at:
http://projects.nytimes.com/census/2010/explorer
You get map data (per census tract) that allows you do display anything from median income, to education, or mortgages consuming 30% of income.
“and NO WAY would this place have ever gone for more than”…
does anyone say this? using ALL CAPS? or are you building your strawman?
Can someone help me out here. 4 trillion in bailouts paid out so far (with another 12 trillion allocated). Unemployment north of 10%. One hot war. Corporations sitting on the their hands with 2 trillion in cash. I don’t understand how a 2 million dollar house is even plausible. Seriously, could someone please tell me what type of work I have to do to earn if income to pay for 2 million dollar house? And what kind of education/ training do I need for this type of work? Thanks.
“earn”
Well there’s your problem. Real wealth comes from being in a position to skim a percentage off the top, not by “earning” it.
is interest income or rental income not earned then?
Unearned income:
“An individual’s income derived from sources other than employment, such as interest and dividends from investments, or income from rental property.
Read more: http://www.investorwords.com/5141/unearned_income.html#ixzz18emzFhmZ“
http://www.investorwords.com/5141/unearned_income.html
”
How could anyone “afford” a $2M house? Consider that they’d need about $650k/year in income and $500k down to comfortably afford it.
Its conceivable, although unlikely, that two high-earning specialist doctors, mid-career, married, could have that kind of an income. The occasional business owner, or perhaps a partner at a very successful law firm, at least in good economic times.
Whether there are enough such people in the world with the means and inclination to buy up every $2M house in San Francisco is probably unknowable.
diemos answered Jimmy’s question before he even asked it. Jimmy, your proposed high-earning couple or business owner or law partner shows that you’re not understanding how things work in the New Guilded Age economy we are living in right now.
The way you “afford a $2M house” is first, that you work in Finance, Insurance or Real Estate (the infamous ‘FIRE’ sector of the economy) and second, you use half the million dollar bonus (or perhaps proceeds from the sum of your year’s commissions) that you “earned” one year for the down payment. You may not have a base salary that puts you in the right category for a straight mortgage, but there are loan products out there for people like you, even post-2008. $650k/year in income is not at all atypical, and is probably a bit on the low side.
True, the obvious answer to the question is “make a lot of money so you have enough to afford the downpayment and monthly payments on a $2mm house.”
But dial back to 2007 and the currently small universe of potential buyers to whom that applies is far, far larger. Then you needed maybe 5% down (or even less), $100,000. Not chump change, but lots of people can put that together with gifts, a middlin’ bonus, and a couple years of saving. Then you get an I/O or neg-am loan, so you’re paying no principal at all for 3-5 years. Now the couple does not need to earn $650k but only about $200k. A lot more people in that category. And you don’t need to worry about the eventual higher costs because (1) I’ll make more money later, I’m sure of it, (2) I’ll be able to refinance later and with all the new equity I’ll be fine, or (3) worst case we just sell and pocket our couple hundred thousand in guaranteed appreciation because SF real estate only goes up.
Of course, the world is much different in 2010, and whaddayano, there really are not that many SF buyers who can afford a $2mm home after all. Perhaps that is why we are seeing these massive price declines in this market segment lately.
@Brama —
You can use the NY Times Census Data Explorer to look around SF at Median and %>$200k data.
http://projects.nytimes.com/census/2010/explorer
You’ll find it tough to find census tracts with over $200k median income. Even in Noe, the richest district I see ( tract 212) only has 38% of households with over $200k household income
The NYT map is based Social Explorer mapping tech. They have a free edition here: http://www.socialexplorer.com/pub/home/home.aspx
But it’s missing some recent income data. Your public library may have full access.
Or you can look up the Census tract # on the free tools for the area’s you’re interested in and then get the text data directly from the census: http://factfinder.census.gov/servlet/DatasetMainPageServlet?_program=ACS&_submenuId=&_lang=en&_ts=
For example I can look up the 212 tract:
http://factfinder.census.gov/servlet/ADPTable?_bm=y&-geo_id=14000US06075021200&-qr_name=ACS_2009_5YR_G00_DP5YR3&-context=adp&-ds_name=&-tree_id=5309&-_lang=en&-redoLog=false&-format=
And see that the Mean income is $186K. Telling me that there can’t be any significant number of Google/Facebook billionares in that tract. And the mean earned income is $174k with 88% of households having earned income.
tc_sf, thanks for the link, I’ll take a look. But with respect to VancouverJones’ original question, there doesn’t have to be lots and lots of people with over $200k median income to support the existence of a $2M home, just a number in the low double digit range will do.
If you’ve got something that shows how many high-earning households have to exist in an area to support a particular residence price point, I’d love to read that.
And if Noe has a section with 38% of households with over $200k household income, to me that’s a fair concentration of rich people that could indeed support a fair number of multi-million dollar-selling-price homes, unless the total number of households is a two digit number.
All of this is leaving aside the assumption that a fair number of buyers in this price range have a higher than average, or perhaps just high, amount of unearned income (using that term in the tax accounting sense, as explained by Jimmy (above at 5:07 AM), not in the moral or philosophical sense). I’m not trying to say that people in this market segment have only unearned income.
Then you get an I/O or neg-am loan, so you’re paying no principal at all for 3-5 years.this link. In the Bay Area, almost three- quarters of mortgage loans taken out last year [2005] allowed borrowers to delay the payment of principal and, in some cases, interest, according to data from San Francisco research firm LoanPerformance. Oh wait, maybe this is a problem…
@Brahma — For a few $2M houses I agree that it only takes a few people able to afford them. But it seems less sustainable when an area is full of $2M houses without the income base to support it.
As far as price support, I’d go with the historical 3-5x income multiplier. 10x seems unsustainable to me. For hard data though, one issue is that for stated/NINA loans the data on borrowers income is by definition unreliable. So data on defaults of these loans is hard to correlate to actual borrower income. So far I haven’t seen anything like a plot of defaults vs price/ actual income at time of sale, which is what I’d like to look at. Also, pre-bubble it’s unclear if there was enough high-multiple lending to have good data.
As far as unearned income, this is more clear. The Census data mean income of $186k includes unearned income. The mean earned income is $174k. So on average, the amount of unearned income is not very high. Note though that the 90% confidence interval on both numbers is +/- ~$30k