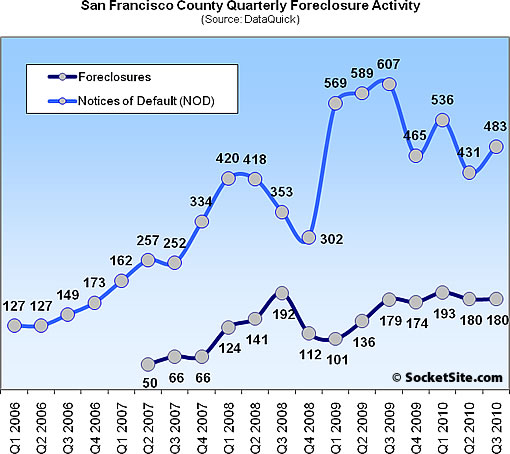
Bay Area Notices of Default (NODs) fell 30.5% on a year-over-year basis in the third quarter of 2010, down 20.4% in San Francisco proper (from 607 to 483). At the same time NOD activity in San Francisco rose 12.1% from the second quarter of 2010 to the third (versus a 3.1% gain from the second to third quarter the year prior).
On average, homes foreclosed on last quarter took 8.7 months to wind their way through the formal foreclosure process, beginning with an NOD. That’s down from 9.1 months for the prior quarter but up from 7.0 months a year earlier. The increase from last year could reflect, among other things, lender backlogs and extra time needed to pursue possible loan modifications and short sales.
Actual Bay Area foreclosures in the third quarter fell 9.4% on a year-over-year basis (from 7,462 to 6,757) with Contra Costa (down 7.0% to 1,909), Alameda (down 20.2% to 1,404) and Solano (up 2.0% to 1,045) leading the way with respect to volume.
Third quarter recorded foreclosures in San Francisco totaled 180, up a nominal 0.6% on a year-over-year basis, even with the second quarter, and versus a 31.6% gain from the second to third quarter in 2009.
∙ California Mortgage Defaults Rise in Third Quarter [DQNews]
it will be interesting to see the effect of the bank perjury scandal on NOD’s and foreclosures.
my guess is that it will not affect NODs but will delay foreclosures, at least short term.
in the end, foreclosures do not make up a huge part of SFs market, although it clearly is an important factor to consider and follow.
Foreclosure sales made up 13% of total sales in San Francisco in Q3 2010, according to DQ numbers, up from 11% in Q2 2010, and 11% in Q3 2009. Doesn’t look like there’s much of a trend to interpret here, just sales limping along and foreclosures continuing to clear at a not-insignificant rate.
warning: rickroll above!
It does seem that no matter how you look at the data the number of actual foreclosures is a pretty small percentage related to the number of NODs. Seems like it is 20-30% average. I would have thought it would be higher given the number of people upside down. Maybe there are a lot of short sales. It would be interesting to see some stats on NODs relative to Shorts + Foreclosures.