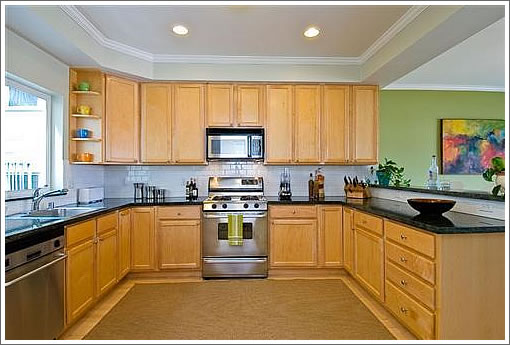
Built in 2000 and sold for $535,000 in March of that year, 662 Capp Street #3 just closed escrow with a reported contract price of $747,500. That’s average annual appreciation of 3.6% over the past nine years.
Or perhaps a bit more accurately, that’s average annual appreciation of 8.4% from March of 2000 to November of 2004 when it sold for $780,000 versus average annual appreciation of -0.9% since then.
Regardless, not to be confused with values in the Mission have fallen five percent.
∙ A Mission Apple Condo Times Two: 662 Capp Street #3 [SocketSite]
I doubt many 2004 to 2009 apples in the Mission will show losses, and those that do are certainly condos.
Oh yeah, I almost forgot…supply vs demand does not apply there…
My back of the envelope calculation is that the 2004 buyer paid about $5500/mo to live in this place, accounting for tax deductions. He could have lived in an awfully nice home over the last five years for that kind of rent.
At least he had almost three years of steady appreciation to cushion the blow from the later crunch. The cost/mo to the 2009 buyer will be far higher, looking back five years from now.
What does “oh yeah I forgot … supply versus demand” mean?
sustantiates what i’ve said all along: that the mish has fallen less than most hoods; 5-10% on average. given we’re in the greatest financial crisis since the GD, i’m cool with those results.
Yes, 5-10% off 2004 prices!
Prove that for the Mission, please.
“Prove” is such a nebulous word in this situation.
If you look at the Zillow graph for 94110 you will see that prices are around the Nov04 level which is down from Zillow’s peak by 10-15%.
Feel free to look at your own data sources and draw your own conclusions.
However, I would agree with hipster that the mission is showing surprising strength relative to the other SF neighborhoods.
“prove it”
Well, there is the place that is the subject of this thread. Down from 2004.
Hard to find real apples. Looks like mostly TICs and multi-unit sales in the Mission. 5 minutes on Trulia shows 3258 25th St, 800,000 in 2005 and 714,500 in Sept 2009. Can’t tell what the deal is with 1800 Bryant #103. 575,000 in 2006. 380,000 in August 2009.
Got anything good showing the Mission has not dropped like these places would indicate?
Zillow is for entertainment purposes only. At least the “zestimate” part of it. The site does have other beneficial features though…
For individual houses yes but aggregates should be more meaningful.
I think I’ll have time later on to look up MLS Mission statistics. Mission SFRs are definitely going to be up from 2004. Condos too. If you would have said 2005, I wouldn’t have questioned it.
For individual houses yes but aggregates should be more meaningful.
Not if every single data point is off.
Haven’t a couple of homes in the mission valecia corridor sell for around 2 million the last couple of years? I think one on 22nd street. I don’t think that would have happened in 2004/2005.
Type “Mission District” into redfin.com
As of Oct. 5th:
Listing $/sf: $544
Sold $/sf: $468
1 year ago both numbers were equal at $600/sq.ft.
Are prices up or down in the Mission? Your call.
Realistically 3-4% is the sustainable growth of the property market over a decade. Growth of 8%+ will soon price the majority of potential buyers out of the market and at some point, in order to sustain the market itself, there needs to be a correction. Typically salaries don’t grow at 8%+ per year, we have to be reasonable.