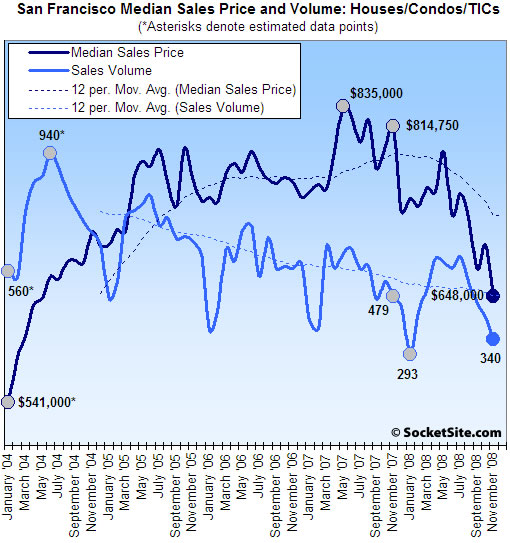
According to DataQuick, home sales volume in San Francisco fell 29.0% on a year-over-year basis last month (340 recorded sales in November ’08 versus 479 sales in November ‘07) and fell 17.9% compared to the month prior. San Francisco recorded the sharpest year-over-year decline in sales volume of any Bay Area county last month.
As always, keep in mind that DataQuick reports recorded sales which not only includes activity in new developments, but contracts that were signed (“sold”) many months or even years prior and are just now closing escrow (or being recorded).
San Francisco’s median sales price in November was $648,000, down 20.5% compared to November ’07 ($814,750) and down 7.3% compared to the month prior.
For the greater Bay Area, recorded sales volume in November was up 12.3% on a year-over-year basis but fell 24.4% from the month prior (5,756 recorded sales in November ’08 versus 5,127 in November ’07 and 7,613 in October ’08), while the recorded median sales price fell 44.4% on a year-over-year basis, down 6.7% compared to the month prior. Once again, think foreclosures.
At the county level, foreclosure resales last month ranged from 10.0 percent of resales in San Francisco to 63.6 percent in Solano County. In the other seven counties, November foreclosure resales were as follows: Alameda, 44.4 percent; Contra Costa, 63.0 percent; Marin, 22.6 percent; Napa, 40.8 percent; Santa Clara, 38.9 percent; San Mateo, 21.8 percent; Sonoma, 51.6 percent.
At the extremes, Solano recorded a 90.4% year-over-year increase in sales volume (a gain of 283 transactions) on a 37.6% decrease in median sales price, while Contra Costa recorded a 61.9% increase in sales volume (a gain of 544 transactions) on a 49.9% drop in median sales price.
∙ Bay Area median home price sinks to 8-year low; sales up over ’07 [DQNews]
∙ San Francisco Recorded Sales Activity In October: Down 21.3% YOY [SocketSite]
Wow. I’m sort of surprised in a good way.
i think the headline for this one should ahve been “sweet jesus”
Sweet jesus! that was a fast drop
Read the full analysis from DQNEWS, 47% of all for the bay area sales were foreclosures and the wealthiest counties, like SF, are posting the worst sales volume.
Wow, SF prices prices actually dropped faster in the past month than surrounding areas. I wonder if that is the first time that’s happened in this downturn.
another way to interpret this:
there are buyers if the price drops enough.
so the “undesireable” areas are showing relative strength again as the economics of the decision now is favoring buying there vs renting there or buying in the “prime” areas.
likewise, sales volumes in the city will increase again once prices in the city drop to levels where buying makes sense again (not saying they need to drop as much as outlying areas, just that volumes will increase if prices drop).
this is also why the old arguments of “SF is special and won’t drop in price just because the suburbs drop” is so silly. obviously it starts to make economic sense for SOME families to buy a SFH for $250k-300k in a far flung crap-burb instead of buyin an $800k 1BR place in the city.
yes, even when you take gas into consideration.
I’ve said this before: but my commute is 12 miles each way, 4 days a week. Despite that, our household’s ENTIRE living expenses is about $4500-4600/month for everything NOT including purchase price of our vehicles which we tend to keep for 10+ years. (the 4500/mo does include car maintenance, gas, etc the 4500/mo also includes travel, and we travel A LOT, usually fly somewhere once per month on average)
===
That said: the Fed is directly targeting house prices now. so all bets are off. who knows what will happen with housing? I’m waiting until the 4.5% mortgage and then I’m refinancing my house. that will give artificial support to the housing market.
of course the big unanswered question: how will the fed unwind itself from all these bets? that is a question for later. obviously, housing will get beat up whenever the Fed drops it’s housing support activities, willingly or unwillingly.
They can target house prices all they want, but with no jobs, house prices will continue to sink.
Tech jobs are going to get clobbered next year. Finance is already dead. It isn’t going to be a good year for bay area jobs next year. That’s why people are DUMPING office sublease space onto the market.
http://www.bloomberg.com/apps/news?pid=20601109&sid=a9q.leOJEybo&refer=home
I just refinanced for 4.55%…
First Republic.
Do it.
I don’t know how the fed can target housing effectively, given the state of the economy…maybe they can soften the blow a tadbit but, they can’t turn it around. We have traveled too far down this road and this particular intersection has a NO U-TURN sign. To top it off, has anyone paid attention to the mess in Sacramento?
Oh darn, looks like my google indicator is now lagging…
I guess the hedge funds aren’t there to arb the spread anymore 🙂 🙂
“this is also why the old arguments of “SF is special and won’t drop in price just because the suburbs drop” is so silly. ”
I would just modify this by adding “…just because the suburbs drop DRAMATICALY.” The fact that SF until recently held up as well as it did is evidence that it IS indeed quite special.
“Wow. I’m sort of surprised in a good way.”
I am very surprised too… also in a good way… my house is still going up…up..uP…UP
anon: what amount did you refinance? I’ll bet it was 625k or less? Thanks in advance for the info.
it was for $625,000 on the nose.
30-year fixed.
0 points.
I think the neighboring counties are benefitting from lower prices AND lower rates.
IMO it’s a plausible scenario that by the time, in a year or so, when prices are somewhat sane in SF, the rates would go up, forcing prices down even further.
SF could be in a world of hurt if something like this comes to pass.
Jake-
I’m shocked at how much traction the “SF is special” myth has. Trust me, there is nothing special about SF. The fact that the nicer interior parts of the metro area have seen less precipitous declines than the suburbs and exurbs is a pattern that has occurred in every metro RE market that I have any familiarity with (Los Angeles, San Diego, Seattle, Washington DC, Boston). In fact, I know parts of at least one of these metro areas that have held up *better* than many properties in the so-called “real SF.”
It’s not SF that is “special.” It’s nicer interior neighborhoods that are “special,” regardless of which metro area you live in. But even those areas are now headed downwards, and no one knows when the bottom will even be in sight, let alone when it will be reached.
Further to anonm’s point (and re-posting a bit):
As has been noted here for a while, SF is simply seeing the same declines as the rest of the area and the state, as one would expect, but it is running about 6-12 months behind. In economics terms, we’ve got a single relevant market here. For example, the June ’08 numbers showed that the Bay Area medians were down by 21.7% while SF was down only 5.4%. So the trend is pretty obvious. Note that SF’s declines in sales volume are the highest in the area — which is what correlated with the massive downturn in other counties. Equally noteworthy is that even as sales volume is up YOY in neighboring counties, median prices continue to plummet.
By now, I think the trend is finally becoming self-evident. So far not a single comment on “skewed by mix” or “medians are useless”, etc.
Don’t get me wrong – I know mix plays a role and medians are an imperfect gauge of the overall market and sub-markets. But it seems most folks are accepting the fact that prices are indeed falling across the city, albeit at different rates depending on neighborhood. Progress.
The market, broadly speaking, is closed and won’t reopen until January. If I was a realtor, I’d be on the phone with clients trying to persuade them that they need to materially lower their price if they want to sell. New year, new price and all that. Shake out the “make me move” dreamers and get the market started again.
anonm: this is just semantics, I know this and agree with you completely. I think we feel the same way but are just saying it differently. I’m sure some (but not all) other posters who say “SF is special” would agree 100% with what you said as well. No snarkiness intended whatsoever, but this could explain the surprie you feel reading such statements in that you may be misinterpreting what at least some of them are saying.
i’m sitting in KC watching SF market from afar, getting listings from two brokers fitting my parameters. i’m finally seeing prices come down, and i’ve been waiting a while. today i got a listing for Central Richmond that looked nice and priced at $357 psf, v surprising.
Very nice looking charts. I’ve pored over the data and come to the conclusion that price declines will accelerate for primo Bay Area, including the “nice” parts of SF proper, and decelerate for the outlying areas and more modest neighborhoods of SF.
Two more years of this and we’ll be only overvalued by about 25%. Not too bad – rents should fall for most of that time, and the choices for solvent people will expand greatly in both rental and purchase markets.
Too bad it’s not possible to short SF houses – it would be a nice ride.
Not much more I can say regarding price trends or ‘SF is special’ beyond what has already been said.
I do find it interesting, though, that volumes appeared to have peaked way back in 2004, even though prices didn’t peak all the way until 07. Maybe my eyes are tricking me, but I seem to see a leveling out of the volume trend line. So, wildly speculating here, perhaps prices became out of reach for most people back in 2004 and those that were buying were caught in the craze or had the income. Volumes have continued to fall throughout the price drop due to a combination of lack of credit/income due to economy, and lack of buyers due to the belief the market will keep falling. However, now with prices where they are, the pressure to buy at these prices begins to appear.
[I’m not saying prices will stop dropping], but I speculate we are going to start seeing volume increases like the rest of the BA counties soon.
scorpio, 17th ave. right? Looks like a good deal (from the few photos)
When those two lines cross…. the world will explode.
[i]Too bad it’s not possible to short SF houses – it would be a nice ride.[/i]
You could get proxy exposure by selling SF Case-Shiller futures contracts?
http://www.cme.com/clearing/clr/list/contract_listings_cl.html?product=SFR
@Jake/anonm
I’m an SF is specialer and I agree with anonm. Nice places in nice hoods, wherever those hoods may be, held (and I predict will continue to hold) their value better than crappy houses in crappy hoods.
I do think these nice houses will get disproportionately hammered if this recession/depression gets much worse. In my opinion, prices for these places is driven more by how much people have to spend than by what one could buy a place for in Stockton. I don’t care how cheap it is to live in Stockton, or Vallejo or wherever, I’m only going to buy a nice place in a nice hood and I’m going to pay whatever it costs, up to as much as I can reasonably afford, to do so. When times are good, a lot of people have a lot of cash to chase after the limited supply of nice houses. If I (and a lot of those like me) get laid off and/or have wealth devoured in the markets, what we can afford goes down and the “bid” on these places will drop accordingly. I’m sure there are a few people who would move to outlying areas to save a buck (or several hundred thousand), but I don’t think it’s the primary force in the nice house market.
LMRiM,
you said “modest neighborhoods”, I think you meant to say Plan C hoods.
FYI, plan C – I think WP is very much a Plan B neighborhood. As you know, I like it a lot. You should change your handle 🙂
(Not sure that’s too good, though, I do think WP will go down more percentage wise than the true “Plan C” nabes, but who knows?)
Just playing, as you know. I didn’t call it Plan C in the first place. WP has 7 new houses looking to get $1.8M-$2.2M next year, so that may set the hood pricing (we’ll see).
I don’t buy the “SF is special” argument at all. As I noted above, SF and its neighboring counties are all a single market, meaning the vast majority of those considering buying a home would substitute one location for another. As an example (purely anecdotal but illustrates the point), of my partners here in the SF office, only about 1/4 of us have a place in SF. Believe me, any one of them could afford even the “real SF.” But they bought in other areas because you get more for your money. E.g. instead of spending $2M (in the late 90s) on a big fantastic place in Pac Heights they spent half that on a big fantastic place in Marin or Berkeley or Piedmont — and they save a ton more because they avoid private school tuition, which is a necessity in SF. In other words, they’re smart with their money.
Price declines in neighboring counties lead to price drops in SF, including the “real SF.” That’s exactly what we’re seeing and will continue to see.
This is true, but this is true of EVER metro area in the United States, heck in Western Civilization. Job centers always hold their values better around the world and the nicest, most well kept areas, hold their values the best. SF is NOT special in that regard.
The SF market isn’t special, the SF market is acting EXACTLY THE SAME as every densely populated job center.
I don’t understand how residents of SF, most of whom seemed to have moved here from elsewhere, have such a warped view.
How quickly we forget 50 years of suburbanization. Conventional wisdom from post-WWII until just a few years ago is that urban core areas are less desirable. Have you ever heard of the term “White Flight”? There are even regular posters here who still claim this.
Wake me up when prices fall below 1980s prices (bulk of my purchases). Until then, I’m up close to 8 figures.
50 years of suburbanization? What does that have to do with prices falling in SF?
Besides, most of the surrounding areas (east bay and peninsula, Marin) were built up way before 1958. Bay bridge was completed in winter of 1936 and the GGB a few months later.
Conventional wisdom from post-WWII until just a few years ago is that real estate was shelter – a place you lived – rather than a path to wealth. The bubble, which started here in earnest in ’01/’02, had more to do with the meteoric rise in prices (and their subsequent fall) than generational demographic patterns or shifts in urban perception.
Trip
If you think you can get a big, fantastic place in Piedmont or Marin in a top school district for around a million, you would be mistaken.
More like 1.5 million+
Though, these neighborhoods will eventually share the same fate as Noe, Pac Heights, etc. They are much more sticky though b/c people will sacrifice a lot to keep their kids in good schools.
arova, read my post a little more closely. I was using examples of late 90s prices, when a number of may partners bought their current places. I use this time period because I’m predicting that’s the level we’re heading back down to. The point is there are a lot of desirable areas in the Bay Area, and prices in our neighboring counties discipline prices in SF.
SF is special in the way that all supply constrained (i.e. hard/slow to build new units) markets are. But this difference is akin to the difference between a rubber band and a string.
On the upswing normal markets respond to increased demand by increasing supply (i.e. stretching) while supply constrained markets can’t do that. If buyers have an unlimited ability to pay, for example by using “nontraditional” mortgages, then prices will rise dramatically in supply constrained markets.
Once slack though both a string and rubber band behave the same. Once demand and ability to pay drop, prices should drop as well (Unless SF plans to aggressively destroy empty homes and apartments).
arova, I’ll agree with your $1.5 million mark for Belveron, but there are plenty of other places in southern Marin where you can find nice homes for well under $1 million (Mill Valley, Sausalito, San Rafael). As for Piedmont, a quick MLS scan shows several 2,000 square foot homes in that area for under $800K.
And don’t forget that renters’ kids go to the same schools as owners’ kids, as LMRiM has pointed out many times. Why would I pay $1.5 million for a place I can rent for $3,500/month?
http://sfbay.craigslist.org/nby/apa/962013626.html
Dude,
That house is right around the corner from me. I rent a $1.2Mish house for $2800/mo. (Got it in July.) I bet you could get that $3500 Mara Vista house for less than $3K per month. It’s been empty for at least 4 months. This is a much nicer area than Belveron. Recently, 3/1s in Belveron have rented for as little as $2500.
There is a renovated 4/2 in Belveron (23 Mercury Avenue) that started asking $4000, and now is down to $3200. We looked at it in July, and it’s still empty.
246 Cecelia is a flip gone wrong, fully renovated and expanded to a 3/2 – in Belveron – and that has been empty forever and can’t get $3900 rent. (It also can’t sell, and the developer will have to give the entire value of the renovation away if he wants to move it – funny history on that one, it was a foreclosure that attracted a specuvestor with more $$ than sense.)
The purchase and rental market here is weakening rapidly. In all sincerity, if one were willing to spend $4K per month, I think you could get a house that recently would have commanded $2MM+ (who knows what it would be worth now, because the market has died).
Here is another flip gone flopped in that general area:
http://www.redfin.com/CA/Tiburon/35-Terrace-Ct-94920/home/17058479
It failed to rent at $5500, so the owner cut the list price again (check the listing history). Maybe it could get $4500/mo because it’s brand new, but I doubt it. The money is gone. Lots of stories of distress up here, and the school foundation is hurting big time for donations compared to last year.
We have an option to renew at the same price again next year, but I expect rents to weaken even further and we may upgrade if we stay in the area.
They are much more sticky though b/c people will sacrifice a lot to keep their kids in good schools.
Looking at the DQ News price/sq foot data, it looks to me that Piedmont, Orinda, and Corte Madera are all down about the same as the 94114 zip code in SF, which is about 13%.
Areas that stand out as being stronger are Menlo Park, Palo Alto, Mill Valley and Walnut Creek (!).
While these are considered areas with good school districts, so are the former, so perhaps more than just school district preference stickiness is going on.
Must be honest – the places posted for rent no matter how cheap they are would not entice me.
That is the thing… you still have people like me crazy as it may be that would rather rent at a much higher price or even buy at a higher price in downtown SF. Some small % of the RE market does boil down to what one desires and what works best for them relative to commute time, etc. LMRiM if I said to you (not that I am bagging on the locale) that you could rent for half what you do in Solano would you move there? Not being snarky I am honestly interested in your response.
Those charts tell you that prices have a LONG ways to go. You need to see volume pick up for even a clue of a bottom. right now, prices are dropping but buyers are not seeing it as a credible floor yet.
plan c-sparky: yep, that’s the one. i dont know much about SF nabes, the few times i’ve been i dont make it much out of North Beach Pacific Heights. but i want to explore more. everyone so dismissive of Richmond Sunset but there seem to be real values out there (tho even the $357 psf in this listing shocked me) and now that i’ve moved back to KC form NYC the last couple years i’ve gotten really used to being in my own house. so, i’ll be out there next spring, my dog permitting, to familiarize myself w the outlying neighborhoods.
trippin’,
“Price declines in neighboring counties lead to price drops in SF, including the “real SF.” That’s exactly what we’re seeing and will continue to see.”
that’s what we’ve been saying all along.
real sf leads by going up $X in good times and outlying areas follow by going up $.25X. then when prices start coming down outlying areas get to lead by going down $X and real sf follows
(eventually) by going down $.25X. pretty simple really…
Yeah, trippin’. SF always goes up a lot and only down a little bit. Long term it works out because of the wealth transfer from the dumber outlying areas to the smarter, ‘real sf buyers’. Seriously, I can’t believe you haven’t figured it out. It’s really that simple, brah.
I actually read it on another site, but it is worth repeating:
1 Lower rates
2 Stabilizing prices
3 Easier underwriting
4 Reduced supply (fewer displaced owners)
5 New housing friendly administration
“wait-and-see” will soon be replaced with “now-or-never”
Are you ready to start buying ahead of the recovery? Know your clients. They need you.
DM, you forgot:
1. Option arm minimum payment crowd (80%!) starts defaulting – increased supply.
2. Not enough qualified buyers compared to the number of formerly qualified buyers who default.
3. If underwriting gets easier, it isn’t going back to the days of no underwriting. Prices will never be the same.
4. Recession and lower tech spending causes even more people to get laid off, leading to lower housing prices (the incoming administration admits it’s going to get worse before it gets better).
Now or never gives way to “later – a la japan” perhaps after a short suckers bounce.
Don’t y’all get too excited. District 10 is the only district in San Francisco with appreciable sales where SFH median prices are down by more than 10% over 11/07. Some districts, e.g. 5, actually show a slight gain in median price over last year (though numbers of sales are of course down … remember that once-in-a-century financial crisis in Sept-Oct?).
Now that median prices are suddenly and curiously important to the SS crowd …
See http://www.sanfranciscoschtuff.com
sanfrantim,
realtor much?
Here are the numbers for San Francisco (from sanfranciscoschtuff.com):
Single Family Homes
Nov. 2002, 2007, 2008
District 1 Nov-02 Nov-07 Nov-08
N Sales 19 24 11
Median
(thousands) $825 $1.260 $1.132
Ave. D.O.M. 47 35 51
District 2 Nov-02 Nov-07 Nov-08
N Sales 60 24 27
Median $569 $844 $790
Ave. D.O.M. 32 28 60
District 3 Nov-02 Nov-07 Nov-08
N Sales 18 15 13
Median $443 $680 $619
Average D.O.M. 31 43 46
District 4 Nov-02 Nov-07 Nov-08
N Sales 41 18 17
Median $645 $858 $1.150
Average D.O.M. 38 41 47
District 5 Nov-02 Nov-07 Nov-08
N Sales 29 37 13
Median $910 $1.390 $1.401
Average D.O.M. 34 33 33
District 6 Nov-02 Nov-07 Nov-08
N Sales 4 7 1
Median $917 $1.825 $500
Average D.O.M. 24 32 109
District 7 Nov-02 Nov-07 Nov-08
N Sales 6 11 4
Median $2.177 $3.200 $2.800
Average D.O.M. 36 51 64
District 8 Nov-02 Nov-07 Nov-08
N Sales 1 0 0
Median $3.200 n/a n/a
Average D.O.M. 18 n/a n/a
District 9 Nov-02 Nov-07 Nov-08
N Sales 24 25 8
Median $581 $850 $831
Average D.O.M. 36 38 38
District 10 Nov-02 Nov-07 Nov-08
N Sales 54 27 37
Median $470 $620 $525
Average D.O.M. 45 60 68
Oh yeah sanfrantim,
Been to http://www.sanfranciscoschandwich.com a few times myself. Unfortunately, nobody else does and it makes for a boring site. Love the numbers, though. I imagine Bernie Madoff would too.
You don’t like those numbers and that site, then go to rereport.com. You’ll find a similar breakdown. That the numbers do not fit your theories about the RE market in San Francisco of course make them wrong. Nor am I a realtor – but nice try.
From Nov 1 thru today, Sales in the northern neighborhoods are down closer to 70%. Prices are down only 9%. One could argue that 70% drop in sales (an unbelievable number) must result in a far great drop than 9% sooner or later. I disagree – Sellers are being as stubborn as the Buyers… and in the wealthier neighborhoods, most can afford to do that. If the stock market stabilizes, look for the home price drops to stop with the Sellers winning the staring contest. If the Dow hits 6,000, the Buyers will win the staring contest. But prices will never, ever drop to “fundamental” levels based on rent vs. own since there is an entire class of buyer who wouldn’t be caught dead in a rental if that had any intention of staying more than a year.
DealMaster,
Everything you post is incorrect.
The US, CA, and SF will have more FC and REO’s in the 12 months than took place in the last 12. Asset value destruction is continuing, there will be no more tech millionaires looking for houses, everyone in financial services is way down, Goldman Sachs is paying its staff HALF this year compared to last year. The entire world is contraction. But hey, I guess if you wish it hard enough it will be true…
real sf leads by going up $X in good times and outlying areas follow by going up $.25X. then when prices start coming down outlying areas get to lead by going down $X and real sf follows
(eventually) by going down $.25X. pretty simple really…
this is not true. it is easily disproven. Look at the RE appreciation of SF vs outlying areas of THIS boom/bust.
you will clearly see that outlying areas apprecated MUCH FASTER than did SF (on a percentage scale).
SF went up steady and strong… but some of those outlying areas doubled/tripled and more. those are the ones that have now crashed and burned thus far in the downturn.
not saying that SF isn’t holding up better than outlying areas (it is), just that your math is way way wrong.
it is and was predictable that SF would hold up longer than it’s exurbs. It is the same pattern seen in the downturns of almost every major metro area. The inner (or high end) nabes hold up better.
Same thing in Seattle, Portland, LA, SD, Minneapolis, Chicago, Austin, DC, NYC, Boston, Atlanta, Phoenix (Scottsdale is their “central” special nabe), etc.
-Detroit is “special” because it’s economy is in shambles right now. even so, the nicer nabes are holding up better than the wrose nabes (like Gross Point better than downtown).
-I’m not sure what’s happening to “core” Miami
-I don’t think there really is a core to LV but if there is it is the Strip, and I don’t know it’s relative performance to the rest of its MSA
-houston/dallas haven’t really been hit to my knowledge, but it’s been a while since i’ve checked them.
San Francisco is special. Here’s why:
Foreclosure resales 10% for San Francisco vs. 21.8-63.6% for surrounding counties.
Foreclosure volume is the single biggest driver of price declines. The more foreclosures, the lower the prices. Banks lower price without sentiment until a sale takes place. They know to minimize their loss, it’s better to sell sooner rather than later, so they chase prices down.
I’d love to see SF foreclosure volume by month to see if the trend is accelerating or holding flat. If foreclosure volume in San Francisco doubles or triples, we’ll eventually see 40-60% price declines.
Why do SS readers think there hasn’t been more foreclosure volume in SF? Are SF homeowners better quality in some way–higher net worth? more singles without family expenses? smarter and less likely to take on toxic loan? able to sell homes before they go in to foreclosure? Other theories???
Or, is SF just a few months behind on the mass foreclosure wave? (In which case, expect 40-60% price declines).
“Are SF homeowners better quality in some way–higher net worth?”
Than homeowners in Tracy and Manteca? Yes.
“smarter and less likely to take on toxic loan?”
No. It’s just that their loans start resetting (and recasting) two years after the ones in the central valley.
“able to sell homes before they go in to foreclosure?”
So far. As prices drop that window gets closed.
“Or, is SF just a few months behind on the mass foreclosure wave? (In which case, expect 40-60% price declines).”
Yes.
@ Diemos
Why do you think SF loans are 2 years behind in resets and recasts vs. other parts of CA? (I hope you’re right, although I hope it’s more like 1 year behind so prices start falling more sooner 🙂
thank you for your response
It is kind of hard to tell who is serious and who is trolling, so I have avoided responding to people on this thread, but as usual, ex SF-er said most of it better than I could.
I have a theory, that suburban homes became relatively more valuable than urban homes from the period 1945-2005 nationwide, though it is probably more like 1945-1995 in the Bay Area. That trend is reversing, which should help SF homes keep their relative value. I have to admit that I don’t have a lot of hard data to support this hypothesis, but I have read it in a few city planning books. Does anyone have long cycle data for home values in urban vs. suburban regions? Price per sq foot data would be especially useful, but is probably not available.
There is a lot of pent-up demand for housing in SF proper, from the rental base. I am not sure what percentage of the 60% who rent would prefer to own, but undoubtedly some portion would. It is hard to imagine what the pent-up demand is for housing in the exurbs. I am also of the impression that there was less purely speculative home buying in SF. I am not entirely sure why this would be, though the fact that a smaller percentage of overall homes were sold in the bubble years must have something to do with it.
There is no doubt some connect between falling home prices in the suburbs and falling home prices in SF proper, but the market overlap between large exurban homes and homes in SF is pretty small. The family looking at a $200k home in Manteca is probably not going to live in a studio here. Though it is conceivable that Manteca home prices can put pressure on Vallejo home prices, which can put pressure on Walnut Creek home prices, which can put pressure … well, you get the idea.
SF has, so far at least, been mostly immune to the home price decline, as sanfrantim and others have pointed out. It is probably not immune to the overall economy and if unemployment continues to climb, especially amongst white collar professionals, no doubt home prices here will drop as well.
I agree that sellers in the northern half of the city have been stubborn so far. In my condo complex there have been a couple of examples of this, one place has only lowered their price by 5% over the last year (the put it on the market for a few months then take it back off for a few months then repeat). Another unit has been lowered by 10% total over the course of about a year and a half on the market (I haven’t looked at it but I suspect it has some negative qualities since a similar unit sold within two months for about the same price that this unit is trying to get).
I just looked at the MLS and there are a lot of Act. Cont. D5 listings. A lot more than I would expect. And I know of 3 december sales in the hood. I say median starts to go back up (the mix).
Full disclosure: I may eventually buy a place in SF (if the price is right), but I have no desire to live in Pac Heights/Marina/Russian Hill), so I could not care less what happens to prices there. That said…
@sfrob: Suppose a certain class of owner would never be “caught dead” in a rental. The key assumption underlying your theory is that there is zero substitution between SF neighborhoods. For example, SoMa prices are unwinding fast – even bulls like fluj admit that. When households in Pac Heights see that they could live in a luxury condo downtown for half the price per square foot, some will consider moving, and that will put downward pressure on prices. Most will not move, because they prefer the more suburban, residential feel of Pac Heights. But the total sales volume is a tiny fraction of the total stock of housing. So to have a notable effect on prices, all you need is for a very small fraction of owners to move.
And actually, I’m the perfect example of this. When I say that I have “no desire” to live in Pac Heights, I mean that I have no desire to live there when other neighborhoods are the same price or cheaper. But if Pac Heights were half the price of other neighborhoods, then I definitely would substitute away from other neighborhoods towards Pac Heights. And this would happen despite the fact that I do not find Pac Heights to be a desirable part of the city.
@NVJ: As the article notes, SF prices are down 21% YOY, which is roughly half of the 44% drop that the overall Bay Area has experienced. How does that translate into “mostly immune” to price declines??
I suspect your answer will be that prices in good parts of SF are not down as much as prices in bad parts. But that’s true in every other county as well. In fact, the DQ data is going to overstate declines in other counties MORE than it overstates declines in SF because those counties have large numbers of low-end foreclosures affecting their medians, whereas SF does not. I just don’t understand why so many views on this board seem to be quite parochial…
Spark – Yeah, I would expect that the high end would get a boost as people rush to try and make it in before the higher conforming loan limits expire on Dec 31. This should show up in number of sales, and possibly prices.
^^^anonm – SF has a much greater “mix” of housing than most other counties. Contra Costa has a smaller percentage of its total units at the top (Pac Heights/Russian Hill level) AND at the bottom (Bayview, etc – can you imagine a worse neighborhood to live in than Bayview? I can’t). Most of the counties like Contra Costa have a much large “middle”.
A new presentation from investment advisor T2 Partners has a pretty comprehensive set of numbers indicating that we have a long way down to go (credit to CR). Much in the presentation is pretty old-hat to many who have visited this site but it is nevertheless a useful recap of where we are and we are are likely headed.
For SF, note in particular pp. 22-24, 30, 33-37, 54-60. and 72.
http://www.designs.valueinvestorinsight.com/bonus/pdf/T2_Housing_Analysis.pdf
Hey Trip, thanks for that pointer, that’s one hell of a scary read.
I have been thinking that those forecasting the bottom in 2012 were drinking too much kool-aid, but now I think they’re just a little bit pessimistic. I think a bottom in the winter of 2010 looks likely.
What I would like to hear is how people think this report relates to the SF MSA, and SF districts specifically.
Will long-term owners with no pressure to sell insulate SF? Will 2006-era specuvestors cause more foreclosures and yank down prices via comps? Will tech/finance job losses kill the all-cash offers?
When will I get my Russian Hill SFR for $600k?
anon – Please, be serious. Are you really trying to claim that there isn’t a huge difference between entire swaths of CoCo County? Try comparing Orinda/Moraga/Lafayette/Walnut Creek/Alamo/Danville to Richmond/San Pablo or Pittsburg/Antioch and get back to me. Or you want to do Alameda? How about comparing Albany/Kensington/Berkeley/Rockridge/Claremont/Piedmont to West Oakland/Fruitvale/San Leandro?
Give me a break. Those regions contains hundreds of thousands of people, and I can tell you that the differences are just as stark as going from Pac Heights to Bayview (more, in some cases more). Enough with the parochial attitudes.
Geez, Bayview isn’t even THAT bad. You people think that if you just step off the bus you will get shot in 60 seconds. You won’t. If you want to see something bad, go take a look at the Sunnydale housing project. Compared to that Bayview will look like Nob Hill.
Page 22 of that says SF has only 3.9% more to fall.
Phew! That was a quick correction. Now back to business.
Oh..wait..what about page 33?
anonm – I would say that on a price/horrible neighborhood quotient, Bayview is quite possibly the worst neighborhood in the US. You can’t buy housing in a housing project.
The difference is this – Bayview prices accelerated at “SF” levels because they happened to be in “SF”. My theory is this – on “quality of neighborhood”, SF is 30% very bad, 40% mediocre, and 30% very good. Contra Costa is maybe 20% very bad, 60% medicore, and 20% very good. Very bad neighborhoods will have the most foreclosures, followed by mediocre, followed by very good.
So…while foreclosures in SF may be the same percentage-wise as Contra Costa, it will be more concentrated in certain areas, because of the additional bad areas in SF.
anon – Who said anything about adjusting for prices? If you price adjust, then for the majority of the population, living in Bayview may be more attractive than living in Pac Heights and living in West Oakland may be more attractive than living in Piedmont (because they’d have to go into indentured servitude to live in Pac Heights/Piedmont). So in fact, price adjusted, there’s little heterogeneity in any of these counties.
We both know that you made up those 30/40/30 and 20/60/20 numbers out of thin air. Go make a spreadsheet using the US Census ZCTA (ZIP Code Tabulation Areas) statistics for CoCo and SF counties. Record the populations and median income so that we can objectively classify neighborhoods as upper/middle/lower class. Then get back to me.
You’re comment on foreclosures doesn’t even make any sense. Foreclosures make up 63% of CoCo County sales and 10% of SF County sales. Unless foreclosures are perfectly distributed through different classes of CoCo housing (hint: they’re not), it statistically inconceivable that foreclosures could be having a bigger effect on the SF median than they are having on the CoCo median.
Your original statement was no different than someone living in Walnut Creek claiming that all SF neighborhoods are pretty much all the same. Just admit that it was inaccurate and move on.
And for the record, I would rather live in Bayview than in the Iron Triangle (Richmond).
Sorry, but someone else has to say it..
Mix is having a HUGE effect on these numbers.
The SFH home price is down 20% YOY from these figures.
But, not ONE district (from those sfschtuff data above) where sales are significant (above 5) shows a YOY decline that large. the closest is d10 with a 15% drop.
Most (d1,d2, d3) are down about 10%. Some (d5, d4, d9) are basically posting a negligible loss or gain. d10 has shown an increase in sales, whereas the other areas are down. d5 and d9 sales are down the most – hence the mix.
Are prices down? clearly yes, but there is a huge mix factor going on when, I repeat, the overall decline for SFHs is larger than any individual areas decline by 25% – and larger by 100% not including d10.
10% is a much better feeling for how much prices have fallen by, in my opinion.
anonm, I honestly have no idea what you’re talking about.
I was simply saying that I thought that some of the neighborhoods in SF were much more overpriced than in other areas, simply because they were in SF. I feel no need to “admit that I was wrong” when I was simply offering my opinion. I wasn’t basing anything on stats and you know that.
To me, West Oakland never got as overpriced as Bayview, meaning it won’t adjust as much. Tract neighborhoods in suburban counties ARE easier to lump all together, because they are TRACT neighborhoods. You sound like someone saying that a unit on the sixth floor of ORH has no relation to a unit on the 12th floor!
anonm – Iron Triangle in Richmond never had houses selling for 600k+.
Bayview did.
anon – Now I’m really confused about what you’re saying. I believe Orinda and Lafayette can be lumped together. I do not believe that Richmond and Orinda and be lumped together. I believe that Pac Heights and Russian Hill can be lumped together. I do believe that Pac Heights and Bayview can be lumped together.
I think that almost everyone on this board would agree with those 4 statements. If you disagree, then you really, really need to visit the relevant areas in either CoCo County or SF County or both.
Regarding W. Oakland vs Bayview, maybe W. Oakland will fall less, maybe it will fall more. But who cares? It’s irrelevant to the discussion at hand.
The only thing I said is that, due to the huge number of CoCo foreclosures, mix is having a bigger effect on bringing down CoCo medians than it is having on bringing down SF medians (see original post to NVJ). There is no mathematically and logically coherent argument that one can give that would contradict my claim.
Note that it is NOT the same as saying that the average SF home has fallen more (in percentage terms) than the average CoCo home. Because the CoCo median has fallen more than the SF median, it is still possible (and likely) that the average CoCo home has fallen more than the average SF home.
Typo: Above should read ” I do NOT believe that Pac Heights and Bayview can be lumped together.” Obviously I wouldn’t expect anyone to agree with the statement as written. 🙂
It sounds like we agree.
I dunno, anonm, I am looking harder at the data that DQ is providing and I cannot understand how they have calculated a 20% YoY median decrease in price in SF.
http://www.dqnews.com/Charts/Monthly-Charts/SF-Chronicle-Charts/ZIPSFC.aspx
Only three zip codes (out of 23) had median price decreases greater than 20%. And they weren’t the largest samples. How can this be right? I can’t even imagine a data set that could produce this kind of result. Also, the other data source:
http://sanfranciscoschtuff.com/2008/12/02/single-family-homes-nov-2002-2007-2008/#more-2966
indicates that prices have fallen quite a bit less than 20%.
Does anyone have access to the raw DQ data?
I only really follow my neighborhood and I would estimate that prices have fallen about 10% from the peak (which was early this summer). This seems like more than just seasonal variation to me, but with so few sales, it is hard to tell.
Others have claimed that the market is going through “price discovery” mode, which is entirely possible, but there isn’t enough data right now to know. I suspect we will find out in the Spring.
I should provide a caveat to what I said above, about most new construction not being a replacement for SF housing. This is obviously not true for the condo towers, which seem to be flooding the market right now. I think that a 2/2 at the Infinity competes with a 2/1 bungalow in Noe, Bernal or Glen Park. I am sure there are other substitutional effects: between SOMA condos and Pac Heights condos, for instance. So this oversupply is likely to put downward pressure on SF home and condo values.
If Bayview homes are so overpriced, then when mix shifts and the median home sold in SF becomes a Bayview home (unlikely), that won’t have such a big effect on dragging down the SF median.
If Antioch homes are so cheap, then when mix shifts and the median home sold in CoCo becomes an Antioch home (more likely), that will have a big effect on dragging down the CoCo median (and in fact, that’s what is happening).
Your points just further support my original claim, which makes me think that you don’t actually disagree with it.
NVJim,
I agree, see my post on this maybe 7 or 8 up.
Where sales fall so much, mix changes can have a huge effect.
JUst shows that socketsite was right all along – although interestingly that message (that mix can hugely distort the median) seems to get less prominence now.
NVJ – I don’t disagree that nice properties in particular areas may have only fallen by 10% to date. I only take issue with your claim that SF has been “relatively immune” to price declines. Taking the median prices at face value, we’ve experienced 41% of the CoCo price decline over the past year. But we know that mix is having a much bigger effect on CoCo than on SF. So that means that we have almost surely experienced at least half of the CoCo price decline, if not more. Hence I think it makes no sense to say we’re relatively immune.
The key to all this is that the average CoCo house has not depreciated by 50% in the last 12 months. That’s not to say that it won’t by the time this is all over, but as of yet it has not. Mix is playing a much, much bigger role in CoCo right now than in SF.
NVJ, that chart is October data, The DQ numbers here are November. Also, the DQ numbers are for SFRs and condos. The MLS data (e.g. SFSchtuff) breaks out the two separately. There is a lot of apples/oranges data analysis going on here.
I wholeheartedly agree that medians are a poor indicator of market weakness or strength. But the RE industry sure gave them a lot of weight the last few years when they trended up. With sales volume plummeting so steeply in SF (sidebar: I don’t see how this could possibly be a sign of anything but weakness), comparing mix between time periods is even more problematic.
That said, I think arguments could be made either way as to whether changes in mix are skewing the medians higher or lower. This is why SS’s “apples” discussions are so valuable. When you see the same exact, unchanged property move up/down in price, it’s pretty hard to argue the market is not moving similarly unless you resort to subjective arguments along the lines of “real SF is different” just because I say so.
True Trip, but the breakdown by district NVJ linked to was for November.
Also http://www.rereport.com/sf/ splits out the SFhs from condos – and shows 20% down for November YOY for SFHs – despite not one district showing this level of decline – and only one (d10) much over 10%.
So when you say
“arguments could be made either way as to whether changes in mix are skewing the medians higher or lower” – I really have to strongly disagree – for SFHs at least.
REporn & others: Part of the reason you’re not hearing about mix in the context of SF is that there is no logical story you can tell that features:
(a) Continued strength in good neighborhoods.
(b) Minimal levels of foreclosures.
(c) Mix putting downward pressure on the median.
If demand were strengthening in good neighborhoods relative to bad neighborhoods, then you’d see good neighborhoods make up an increasing percentage of sales (which is what we saw during the later parts of the boom, particularly when we got near the plateau and the market started slowing in the less desirable neighborhoods). This shift in mix boosts the median; it’s basically the aggregate analog of Satchel/LMRiM’s “beauty pageant effect.”
So there are only two ways for the mix to then work in reverse. First, the market could get stronger in the bad neighborhoods relative to the good ones. This is possible, but if so it raises serious doubts about the theory that good neighborhoods will be immune to the big downturn that has hit bad neighborhoods. Second, foreclosures in bad neighborhoods that must go at any price could massively increase the share of properties being sold that are in bad neighborhoods. Thus bad neighborhoods get big increases sales share even though they’re not doing well at all. That’s exactly what you’re seeing in places like CoCo and Solano. But it has only limited effect in SF because, as we all love to note, SF has a very small share of total sales that are foreclosures.
Looking at the district level sales, it’s quite obvious what is happening. Districts 10 is holding up in sales (actually increasing by 10 sales YOY), likely due to a concentration of foreclosures in that area. But D10 sales are still just a small fraction of SF sales. To get a substantial mix effect you need sales to plummet in the better districts, which is exactly what’s happening.
End result: Yes, there is a mix effect. But it’s being driven by a sharp drop in sales in the better districts – it’s not being driven by Pac Heights staying hot and Bayview getting super, super hot. In other areas, a drop in sales has been the precursor to substantial drops in price. Will this area be different? Doubtful.
Actually, the SFH data above make it crystal clear what’s going on. In my book, Districts 1 and 5-9 are “real SF”, Districts 2, 3, and 10 are “fake SF”, and D4 is ambiguous (I could see arguments on either side).
Sales figures for Real SF:
Nov-02: 83
Nov-07: 104 (+25% vs 02)
Nov-08: 37 (-55% vs 02)
Sales figures for Fake SF:
Nov-02: 132
Nov-07: 66 (-50% vs 02)
Nov-08: 77 (-42% vs 02)
In 2007, the bulls said, “The market is holding up in the better neighborhoods.” And they were right. And the bears said, “But that means that mix is working to increase the median price.” And they were right too.
In 2008, the bulls are saying, “Mix is working to decrease the median.” And they are right. And the bears are saying, “But that is because the market is collapsing in the better neighborhoods.” And they are right as well.
REpornaddict,
The median price for the different districts varies wildly (e.g. $1,166,000 in D1; $500,000 in D6 for SFRs) as does the sales volume in each district. So a relatively small drop in % terms in an expensive district (e.g. down ~ $100,000 in D1) can (but does not necessarily) have an outsized effect on the city-wide median. The variance within a district can also be huge. And, of course, the median price is just the middle of the group. So without knowing every single property in the mix and analyzing it, we can’t really say with certainty how mix changes are affecting the broader median. We can make up arguments either way.
anonm’s take on things makes pretty logical sense.
SFR mix according to the MLS
YOY D-10/Oceanview/Ingleside 9/22- 12/19:
2008: 154 sales at 437 a foot
2007: 129 sales at 493 a foot
All of San Francisco:
2008: 472 sales at 543 a foot
2007: 550 sales at 683 a foot
So that’s 32.5%, almost a full third, of SFR sales in areas that have bottomed by 15% this year.
Last year that area represented 23.5%, less than a quarter, of SFR sales in areas that had yet to bottom out.
How much does a 19.4% increase in volume, encompassing nearly 1/3 of total SFR sales, in bottoming areas, with less total sales citywide, effect mix?
Fluj, you’re engaging in classic apples-and-oranges invalid analysis. First, you’re using average $/sf numbers in an analysis of median prices. Second, you’re ignoring the variance in prices. Third, you’re using a different time period (9/22-12/19) than the November YOY period at issue. Fourth, you’re doing nothing at all to look at the overall city-wide mix. I’m sure there’s more. Your numbers are interesting, but they shed little to no light on the relevant question.
What you show is that d10 has seen a $56/sf drop and the city as a whole has seen a $140/sf drop. Hmmm.
What flujs numbers further highlight is the inaccuracies of city wide median data – the $ per sq ft as much as the median price it seems.
We all know d10 has been the worst hit so far – and its down 12% $ per sq foot while citywide shows down 20%. Like the median, showing 15% and 20% respectively, even though no other area showed more than 10%!
Theres lies, damned lies and SF median price data.
Exactly, Trip. The given data can really only be reconciled by a GREATER pecentage drop in fluj’s “real” SF (not D10/Ingleside/Oceanview) than that in the fake SF, although so many assumptions need to be made about the data sets that it’s not worth the effort to try to draw any inferences.
IMO people need to be extremely careful of any statistics offered by realtors. In my experience, the overwhelming majority have absolutely zero understanding of statistics principles, and the few that may have no interest in providing accurate analyses (and are not likely to be involved in residential real estate).
For instance, take a read of this absolutely laughable demonstration of statistical innumeracy:
https://socketsite.com/archives/2008/08/four_years_of_district_4_equity_yet_preforeclosure_afte.html
(See “Posted by: PUAgent at August 19, 2008 12:17 PM”)
I am a small government guy, but if any industry needs big-time heavy-handed regulation it is this one. These clowns are dangerous to people’s wealth, and get away with stuff that would land lawyers and investment advisors (yes, even Wall Street fraudsters!) before disciplinary review panels.
Here comes Satchel with his “real” “fake” and requisite realtor bash.
yawn.
How do you explain the lagtime behind much of the rest of California?
Excellent point! Here is my take:
a) In the outliers, existing homesellers must compete more with homebuilders that have been cutting prices to clear an inventory glut. This forces price discovery to happen faster.
b) Cookie cutter houses/neighborhoods. When a single house 4-5 blocks away sells for less, it is harder to claim that yours is unique. This also increases the speed of price discovery. Positive feedback with a).
c) When homeownership rates are high (i.e. more poor people own homes) then a smaller “hiccup” in prices/cash flow will force a foreclosure or other “motivated sale” because the seller has a smaller asset cushion and maybe living paycheck to paycheck. Combine this with b), a).
d) Rent control: The outliers tend not to have rent control, so that rental prices fall faster during downturns, changing the rent/buy calculation.
e) Trend following: there was much more money to be made by flipping in the outliers, because prices increased much faster there, therefore one would assume that a greater proportion of sales were speculative. Speculators will head for the exits faster because they can’t wait things out if rents are low. Moreover, the “pride of ownership” factor is missing. They may be more levered as well.
The above points help explain the difference in volatility, but not necessarily the “start times”, although one would expect more volatile areas to exhaust themselves sooner, and therefore collapse faster. For more on the timing:
House prices began to decrease (Case-Schiller SF MSA) in the outliers in January 2007, coinciding with a rising unemployment rate (which bottomed in 2006). The population in the outliers is larger, and is therefore more likely to reflect the macroeconomic data such as unemployment. A city as small as san francisco is more able to resist this trend, statistically. In fact, employment here has held up better. Moreover, SF homeowners get a disproportionate amount of money from unearned income. Note that the equity markets tanked much later than employment, so you would expect a time-lag.
That is an excellent analysis Robert. I might have a simpler one.
1. The rest of the state was dragged down by the sub prime problem. The bay area, with its high incomes, did not have much of a sub prime problem. Robert points about supply made the problem worse in those other areas, but masked it here, and this made those problems worse.
2. Unlike in past downturns, in which the economy brought down housing, this time, housing fell and has now started bringing down the economy.
3. The collapse in SF home prices is a result of the falling economy, not so much loan problems. Falling stock prices and a falling economy (layoffs and no jobs) have started problems BEFORE the alt-a recasts.
4. The alt-a recasts are going to pile on.
5. The government might actually come up with a program that really does something (as opposed to the fake programs that have been touted, to soaring stock prices the next day, without helping anyone), but that is going to be applied to homes under $625K, which dilutes its impact here. However, any such program will drag the economy down, or at a minimum, prevent a recovery, making bay area problems even worse. So if they succeed in helping homeowners, it will actually make bay area problems worse, without helping many homeowners.
DataDude,
I point you to the infamous Credit Suisse reset chart. The teaser period varied according to loan type and was generally:
subprime 2-3 years
Alt-A 3-5 years
Prime 5-10 years
so you can see from the chart that subprime resets are winding down at the end of 08, 09 is a lull, and then Alt-A and Option Arm resets start ramping up in 10.
http://www.calculatedriskblog.com/2007/10/imf-mortgage-reset-chart.html
Fluj correctly pointed out in another thread that all loan types were equally AVAILABLE in all area of california but they were not equally USED in all areas.
Subprime was used by people with poor fico scores to buy cheap houses they couldn’t afford in cheap areas.
Alt-A was used by people with good fico scores to buy expensive houses they couldn’t afford in expensive areas.
looking at prime only in that figure, Q1-Q2 09 does not look good.
I wish CS would update their chart based on the enw reality
“Alt-A was used by people with good fico scores to buy expensive houses they couldn’t afford in expensive areas.”
That chart shows Alt-A as not approaching being as big of a problem as subprime at any point, and option arms to not approach subprime until 2010, and to not surpass it until midway through 2011. Meanwhile, we are not in the same mindset as 2006 and forces are at work to prevent these resets from occurring. So we’ll see.
“So we’ll see.”
Indeed. In the year and a half since this chart was made many mortgages have dropped off this chart, having been refinanced or paid-off, and new ones added. It would be fascinating to see an updated version but I wouldn’t hold my breath. Ivy Zelman got shown the door at CS for showing this chart around.
“option arms to not approach subprime until 2010”
True. But subprime was spread throughout the country. I give you the “map of misery” to show you where the option arms were used.
http://www.businessweek.com/common_ssi/map_of_misery.htm
San Francisco is not depicted on that map? Curious. It has to fall in there somewhere.
@ diemos – still reading thread, and thanks for detailed answer 🙂
fluj, diemos, others – In theory it’s possible to get stats on Alt-A mortgages by county from the NY Fed Dynamic Mortgage Map. Unfortunately it no longer appears to give you numbers by county though – it just shows you the shade of the county.
However, Socketsite took a screenshot of the SF stats when the site was working properly. That shows an average of 25 Alt-A’s per 1K housing units vs. a current average of 41 Alt-A’s per 1K housing units for all of California. So at first glance it seems that SF is in somewhat better position than the most of California, though in a much worse position than most of the country (25 Alt-A’s per 1K units is higher than every other state in the US except Florida and Nevada).
But even that is an overly optimistic interpretation. The problem that the “1K housing units” include rentals, which make up the majority of SF’s housing stock but only a minority of the housing stock in most other CA counties. So the ratio of Alt-A’s to actual units in the residential housing market is likely higher in SF than in, say, CoCo.
For example, SF and CoCo have approximately the same number of housing units (356k vs. 389k respectively). But CoCo sales volume is about triple SF’s sales volume. And I’m talking about from 2004-2006, not now when CoCo is being juiced up by foreclosures while SF is collapsing (the ratio of CoCo to SF sales last month was 4.2). The main reason for historically higher sales is not that CoCo is a much more desirable place to live, but rather that most of SF’s housing units are rental units that trade hands very infrequently (special thanks to Prop 13 and rent control).
In summation, the ratio of Alt-A loans to units in the residential resale market (or the potential residential resale market) appears to be higher in SF than the average California county. I, for one, am unlikely to put down any money here until we get through a good portion of those recasts.
Upon further thought, someone should really get the “sub-prime per 1K housing units” county stats and using the Census housing units numbers to back out total sub-prime mortgages. Then compute the ratio of sub-prime mortgages to average sales by county and use that to predict the price declines we’ve seen over the past year. I bet it would have pretty good predictive power…I’d take it against dubdub’s patented lazy GOOG indicator any day. And then you could use the results to take a guess at how bad things might get in various counties (and here in particular) when the Alt-A recasts hit.
@ anonm – brilliant analysis and granularity. Add to that SF’s demand curve has probably taken a much larger step to the left than other counties just because things are so much more expensive. In some cases, this step is so big the buyer has entered a surrounding county. Stepping over the Bay–that’s a big stride!
“For example, SF and CoCo have approximately the same number of housing units (356k vs. 389k respectively)”
is this true? any link?
While subprime was fixable, most alt-a is hopeless.
Subprime loans had a teaser rate of 1-3%, but then a punitive rate of 8-11% or more after the first two years. The theory was that after the first two years, your credit score would be higher because you had been making the payments, and so you could refinance into a conventional mortgage, so as long as you made the payments, you would be fine.
The problem with sub prime mortgages were two fold. First, when the values started dropping and LTV requirements started to increase, no one could refinance. For a few of these people, had they been able to refinance into the same principal at a rate more reasonable than 11%, they could in fact make the payments. Going from 3% (the teaser rate) to 5% (todays rate) is at least possible for some people. But that wasn’t even the worst problem.
The worst problem was that so many people had been put into these loans not because they were subprime at all, but had been put there to get the teaser rate because it was the only way they could make the payments. They were in fact only able to pay if interest rates were 1-3%. Otherwise, they couldn’t make the payments at all. So even if they refinanced into a 5/1 prime arm at 4.5% the end of the teaser period for the full loan amount, they had no money to pay that.
The loan officer was assuming that they could, at the end of the teaser period, refinance and take cash out and use the cash, and maybe a higher wage, to make the higher payments. And if they couldn’t, well, they could sell for hundreds of thousands of dollars more than they bought it for, so who cared?
So congress set up all sorts of programs for these guys, but the reality was, very few of them could pay. The number saved by these programs has been in the low thousands nation wide.
But now look at Option Arms. Everyone claimed to be surprised that 80% are making the minimum payment, but that was the only way they could afford the payments at all. The loan officer put them in that loan because it was all they could afford.
They are in the same boat. They have been paying the equivalent of about 1% interest. They cannot afford to pay more than that. Want them to pay 4.5% interest? Guess what: you need to drop the loan balance by MORE THAN 75% to allow them to afford 4.5%. (1% of $1M is 10K in payments per year, 4.5% of 250,000 is 11,250 per year in payments). Do you think your friendly B of A contact is going to forgive 75%+ of the loan amount? Not gonna happen. Some can pay, but most CANNOT pay anywhere close to 4.5% of the current value of the home. That’s why they are in the loan.
But there isn’t going to be any forebearance of 75%+ of the loan amount. EVERY ONE OF THOSE LOANS FOR WHICH THE BORROWER IS STRETCHED AT 1% WILL GO TO FORECLOSURE because the lender makes more money foreclosing at 50 cents on the dollar than he will if he refinances at less than 25 cents.
These people are not in a 5/1 arm that could reset lower, they are in a ticking time bomb!
Congress can come up with any kind of program they want, but they cannot turn lead into gold.
These loans are a disaster and the problems start next year. Any one who buys right now IS AN IDIOT!!!
tipster,
where is your information from on the 1% rate that people have been paying. What percent have that loan in SF? And, what % of those didn’t put money down? Because I know lots of people in SF with alt-a and they put money down and the “teaser” rate isn’t much different than the current rate. No 1% option.
Also, anyone who looks up other peoples person information to post on SS “IS AN IDIOT!”
sparky,
There is the rate and there is the equivalent rate that you pay if you pay the minimum payment. Say you have a $1M option arm loan. Your initial rate is 4.5%. But your minimum payment amount is $850 per month. That works out to about $10,000 per year, or the equivalent of 1% on a $1M loan. Now you are NOT paying 1%, you are paying 4.5%, but the difference is added to the loan amount as negative amortization.
So these people can tell you that if rates reset to 4.5%, then woo hoo, they won’t be paying more than they are now. But the problem is that they will no longer have the option of paying the equivalent of 1%, with the remainder being added back to the loan. For those who were put into the loan for the simple reason that $850 per month is all they can afford, they are screwed, even though the loan will reset to exactly what their interest rate is now. The problem is that their interest payment will go up to about $4000 from 850.
This is how secretaries in the bay area could out bid professionals for $2M homes. The one who did that to me is paying about $1700 per month (before taxes!), plus $2K in property taxes. She’ll get hit by the AMT, but the 3700 payment is manageable. It will go to 9700 (double the 4000 above – it was only $1M, and that doesn’t include the additional loan amount from the negative amortization – it’s probably closer to $10K) and I don’t think many secretaries can afford that monthly payment.
Call me an idiot, but I think I’m pretty safe with that assumption.
I know how they work tipster, I have one. And, never was there an option to pay as little as you state (not even close). So that’s my question, do you have any information how many people have that option in SF? Otherwise like you and so many people here say ad nauseum “it’s a strawman argument”.
“Any one who buys right now is an idiot” puts me in mind of Twain’s saying about generalizations and their worth.
The loan officer put them in that loan because it was all they could afford.
I 100% disagree with the idea that this is the loan officer’s fault. A borrower that takes one of those loans that they can’t afford are the idiots, and asses too. When you get a GFE the fact that payments will double in a few years is screaming at you in the face. These people with defaults imminent are so dumb that I don’t understand how they can dress themselves. How is it that there are literally millions of them in the USA? I know a lot of unintelligent people, yet they almost always err on the side of choosing loans that are too conservative, e.g. getting a 30 year fixed when they’re certin to move within 10 years, or putting down 100% rather than getting a mortgage at all. I bought last year because I didn’t think the number of homeowners that are both stupid and evil would be enough to destroy an economy.
Blaming the lenders is like blaming a liquor store for alcoholism — it’s the self-destructive people that are the problem. Granted, I would argue that there’s almost no responsible way to use a loan with a 1% teaser rate; those loans should be banned, just like how it’s illegal to sell crack in a liquor store.
Sparky,
No one has that kind of rate info, but I think you may be getting Alt-A and Option Arm confused. Forgive me if I am explaining what you already know, and please correct me if I have any o fthis wrong.
Alt-A were for people who had good credit scores, but did not document their income. They didn’t document their income because in many cases, they didn’t have the level of income required to get a loan for the amount they got.
You could get any flavor of alt-a loans. One flavor had a fixed rate for a period of time, then a reset to an adjustable rate. In those causes, no harm or foul because for those people, their reset will not be much more than what the initial rate was.
Others had a negative amortization feature, where the loan balance accrued, but you didn’t have to pay it. The bank would wrap it back into the loan and finance the payment until the loan balance reached a certain level, at which point they would stop doing that, and you’d have to start paying off the interest and principal on the higher amount.
The minimum payment amounts were all over the map. I haven’t seen any stats on what they are, but if you assume that the recast caps were 125% of the loan balance (they varied from 110% to 125%), and you could actually hit that in about 4 -5 years (if you couldn’t, they wouldn’t have the cap), that means that on a $2M loan, $500K could be accrued but not paid interest during the first 4-5 years, roughly $100K per year, or 8K per month. (This is a very rough calculation and does not take into account the accrued interest on the accrued interest, so it’s nothing more than a back of the envelope approximation).
But the numbers are close to the numbers I posted above, so I doubt I’m too far off.
If you can explain how you get to a 125% number in 4-5 years with a different theory, I’m all ears
I didn’t think the number of homeowners that are both stupid and evil would be enough to destroy an economy.
I like the anger 🙂
But I do hope people try to see the good that potentially could come from what’s next. The economy was on an unsustainable and very unproductive course. Bubble after bubble had been engineered (wittingly or unwittingly) by the fraudsters at the Fed and the government, and the voters were too dumb to realize what was going on. Perhaps this will wise them up (although I doubt it). At least there’s hope now.
The depression is the natural and desirable resetting of all the foolishness that has gone on for at least 15 years. It is the process in which capital is returned to its rightful owners, who can (and will) make better use of it. Let’s hope the government doesn’t get too much in the way of what has to happen.
I don’t think he’s questioning that some of the types of loans that you’re talking about exist, but just how many of those are out there. You take every “range” that you throw out, then immediately assume that most or all loans must be at the worst end of that range – for example, you say 110%-125% caps, then immediately talk like all loans MAXED out the cap at 125.
That’s a valid point, anon. I think the number is greater than zero, but I don’t know what it is. In any event, it doesn’t really matter. The lack of jobs disappearing this year and next year will be a greater influence than toxic loans. To a lesser degree, the fact that the burbs are now dramatically cheaper also has an influence on SF prices. Even if no more than 1000 of these loans cause people to get foreclosed upon next year in SF, it’s just fuel to the jobless fire.
In our case, our flow of money is going to be interrupted for awhile. The valley relies on pension fund money to fund startups, who pay salaries and more established companies (for rents, electricity, food, office supplies etc) and then sell. The money from the sale gets distributed, some back to the investors who are out of the area, but some distributed locally and spent. But the pension funds are all hurting from their losses in mortgages, derivatives, and the stock market.
So not only are jobs disappearing, but the regrowth machine we have here is sputtering, and probably will for awhile.
I posted about the toxic mortgages because that was the topic, but I think that jobs will have a much greater effect on this, and it doesn’t look good on that front either! But your point is well taken, not every option arm mortgage is going to blow up, just like not every sub prime mortgage did.
“For example, SF and CoCo have approximately the same number of housing units (356k vs. 389k respectively)”
is this true? any link?
Paco, common sense would tell you that it must be true (or at least very close to true) because the populations are fairly similar (800,000 for SF vs 1 million for CoCo) and SF has more singles (so it should have more housing units per capita than CoCo).
Anyway, yes, it is definitely true. Here are the links:
Housing units in Contra Costa: 389,100
Housing units in San Francisco: 356,470
For completeness I will note that the NY Fed Mortgage Map technical appendix says: “Data on the number of housing units are drawn from the U.S. Census 2000.” So there is no question that these are the right numbers. (The only discrepancy is that we are using 2006 numbers and NY Fed is using 2000 numbers. The 2000 numbers appear to be 347k for SF and 355k for CoCo, which only strengthens my claim that they have approximately the same number of housing units.)
Sparky & anon – Tipster may be focusing on worst-case scenarios, but let’s step back and review the facts that we know:
Fact: California has by far the most Alt-A loans per housing unit of any state. Source: NY Fed Mortgage Map
Fact: San Francisco has more Alt-A’s relative to the size of its housing market than many California counties, including the oft-maligned Contra Costa County. If you ranked all 3,000+ counties in the US by Alt-A’s per 1,000 housing sales, SF would almost surely be in the top one or two dozen. (In contrast, SF has substantially fewer sub-prime loans per resale housing unit than many CA counties, including CoCo.) Source: NY Fed Mortgage Map plus calculations documented above.
Fact: Alt-A loans, as defined by the NY Fed, generally feature one or more of the following characteristics: Poor credit score (but not poor enough to go into sub-prime category), undocumented income, interest only payments, Option ARM (i.e. “pick a payment” – basically what tipster is referring to above). Source: NY Fed
Fact: At a national level, Alt-A’s are becoming a disaster. 41% of Alt-A’s are underwater. 70% may have exaggerated their incomes. 80% in the option ARM category are choosing a negative amortization payment. Option ARMs are recasting substantially sooner than forecast (due to owners hitting the loan balance cap). To quote a senior federal bank examiner: “The next problem is with the Option ARM product. Approximately 80-90% are paying the minimum credit card payment and most loans are negatively amortizing…Also, 73% were underwritten with Low or No Doc. The option arm
books of many lenders are already showing significant deterioration and they have not even recast yet. This is the next tsunami to hit the housing market. This will hit much higher price points $600k and above as this was the affordability product used by higher income/higher FICO score households to buy that dream home.” Source: http://www.designs.valueinvestorinsight.com/bonus/pdf/T2_Housing_Analysis.pdf (pp. 23, 60, 61, 67)
Given those facts, the only way that SF could escape relatively unscathed is if our Alt-A borrowers are vastly different than the Alt-A borrowers virtually everywhere else in the country. Honestly, the best case would be if all our Alt-A’s were just people with low credit scores but high incomes. At least they might be able to pay in theory. But that seems hard to imagine. More generally, if everyone in SF has the credit and income to get a prime mortgage, then why do we have one of the highest concentrations of Alt-A loans in the country? These people can qualify for prime, but they all choose to go the Alt-A route instead? It’s theoretically possible, but it certainly doesn’t make any sense.
Now, I don’t dispute that everyone here may have one or two anecdotal friends that have Alt-A products and are still safe at the moment. I personally know someone that bought with an interest only loan around 2004-2005 and refinanced into a fixed rate a year or two ago. But assuming that the vast majority of the Alt-A’s in the Bay Area look like that – i.e., that our Alt-A’s are all uber-responsible and it’s just everyone else’s Alt-A’s that are in over their heads – seems like very, very wishful thinking. At a minimum, I sure wouldn’t put a bet on it in the form of a downpayment right now unless I was perfectly fine with losing 100% of my money. Oh, and I also heard that maybe the economy is having problems, but that’s another story.
Whether some in the SS crowd think it ‘idiotic’ to buy now is not a very trustworthy guide. Aren’t these the ones who sat by and did not purchase in 2000, 2001, 2002, etc. — with no doubt sound theories at the time as to why not — and, having missed the RE appreciation, are now cheering the market down? Only, the numbers may not be fully cooperating with their theories — not yet maybe, but wait ’til next year. So what, if they admittedly ‘don’t know’ about the Alt-A loan status of SF owners, they are equipped with many long paragraphs full of supposition and speculation nonetheless.
Well, yes, the economy sucks and it probably is going to get worse. It is either a terrible time to buy — or a great time — depending on your circumstances and what happens next. Who can say more?
I guess I see the numbers differently, hence my question about the 1% teaser and who had that. Here’s an example; Minimum payment 12/06 was $3900, on 12/08 full amortized $3700. How is that that this is going to recast so drastically when it’s been getting more than paid off with the old minimum.
thanks for the links anonm
I am not trolling. I watch this site because we decided to sit on the sidelines in 2006. Okay, we can buy a house in the city but, here is the deal:
1. We have tech money. Wall St just slid. We have a heck of a lot less tech money than we did just six months ago–and, I mean, a heck of a lot less.
2. Why would we put this money, a lot less money, into a home now? Let’s just say we lost 30-40% of our investments. Why would we buy a home that depreciated only 10% or 20%?
3. What is to say that we buy, after loosing 30-40% of our investments, only to watch our home depreciate even more?
We don’t know when to buy. But, now is not a good time for us to loose more $$$$ in home depreciation. And, we just aren’t comfortable taking the chance.
there’s no need to hurry. and its usually better to wait for a good situation rather than a ‘good deal’.
sanfrantim – I can’t speak for everyone else, but I personally was not in a position to buy here (or anywhere, really) until 2006. At which it was blindingly obvious, IMO, that things were overpriced. But I can only speak for myself.
One last fun fact gleaned from the available NY Fed Mortgage Maps data (combined with DQ and Census data):
The first wave of the crisis has been dominated by subprime mortgages. The number of subprime mortgages in California is equal to 14.2 months of sales based on 2007 sales figures.
The next wave of the crisis is expected to be dominated by Alt-A mortgages. The number of Alt-A mortgages in SF is equal to 19.3 months of sales based on 2007 sales figures.
Yes, you read that right: our Alt-A exposure is not better than California’s subprime exposure was – it’s actually 35% worse than California’s subprime exposure was.
It may take more than “specialness” to ride this one out.
But the Alt-A recasts have not really hit SF yet, therefore they might not and in fact they probably won’t!
correct me if i’m wrong but aren’t the alt-a mortgages based on much much better rates and terms than the sub-prime ones?
and does that not imply that these recasts will not be so onerous and that the borrowers have more choices than mere sub-prime-schlubs?
Just for you paco.
http://www.housingwire.com/2008/12/15/fitch-alt-a-mortgages-deteriorating-more-rapidly-than-expected/
“Whether some in the SS crowd think it ‘idiotic’ to buy now is not a very trustworthy guide. Aren’t these the ones who sat by and did not purchase in 2000, 2001, 2002, etc.”
sanfrantim – SocketSite did not exist back then. Perhaps some of the bears here were bearish back then too though we have no way to determine that. I can only speak for myself : I was quite bullish in RE in 2002.
I have been bearish since mid-2004. Unfortunately that’s about the 1st time I actually had enough for a 20% downpayment. I will admit that i put in three offers in 04, but absolutely refused to overbid. I feel very good about other’s insanity now, as it stopped me from making a bad financial decision. Dec 08 now looks like Dec 04 in SF proper. Dec 09 will probably look more like Dec 02 in SF proper (the real SF) Again I plan to buy in mid-2010, when I expect we will be at mid-2000 prices.
thanks for the link diemos. while i’ve heard similar bad news about alt-a rmbs pools i’ve still not been able to get my head around the thought that we’ll see this level of failure locally.
anyway, my question remains; aren’t the rates and terms for alt-a products much better than sub-prime ones? does it not stand to reason that many will be able to hold on in sf b/c their resets aren’t punitive (like sub-prime)?
“Dec 08 now looks like Dec 04 in SF proper.”
Anyone who takes a moment to compare prices in any part of the city YoY 12/04 to 12/08 will see that that statement lacks any merit whatsoever.
“that statement lacks any merit whatsoever”
iow; classic spencer
Anyone who takes a moment to compare prices in any part of the city YoY 12/04 to 12/08 will see that that statement lacks any merit whatsoever.
Sorry to disagree with you fluj, but isn’t that the point of the SS chart that got this whole thread started? SF 2008 prices are back to 2004. Just look at the chart.
how does my statement have no merit. Have you read the chart and article that we are wrtiting about?
Yes, I read the chart and the article. You know what? I misread your statement. You said December, not “2004.” December 2004? sure. OK. That was after the big jump in values. I’m sure the aggragate numbers do resemble November 2008 due in great part to mix. If you go around from neighborhood to neighborhood you’ll see something else though.
For a majority of the option arms, the minimum payment is less than half the fully amortizing recast amount, even at today’s interest rates. They owe more than the original loan amount. They cannot pay it. And by definition, they are underwater, so they cannot refinance.
That puts them into prime walk away territory.
tipster, where is this information from (for SF)? Because mine is so drastically different than what you say, I find it hard to believe that “the majority” have a minimum payment that is less than 1/2 of the full. Like I said earlier my full amortized is less than my minimum was just 2 years ago.
Yes tipster, I too would be interested in any data showing that the majority in SF or even the Bay Area are as you describe. We all know that some of those loans exist, but I have no idea what the makeup is in entirety, but I would be interested to know if you do have something showing real data.
sparky and anon – I’m pretty sure the data that you’re asking for don’t exist in publicly available form.
At the national level, we know that ~80% of Option ARMs are negatively amortizing and that the average monthly payment jumps 63% upon reset (http://www.designs.valueinvestorinsight.com/bonus/pdf/T2_Housing_Analysis.pdf, p. 61.
So tipster’s comment does appear to be supported by the available data (if the average loan jumps 63% upon reset, it’s likely that 50% of loans or more could jump by 100%).
If you want to believe that Alt-A will be no problem for SF and the greater Bay Area, your only reasonable recourse is to believe that Bay Area Alt-A borrowers are much more responsible than the average Alt-A borrower. Our Alt-A borrowers all could have qualified for prime loans, could have provided documented income, could have easily made full payments, but for some reason chose not too. However, the Bay Area subprime borrowers have turned out to be no more responsible than subprime borrowers anywhere else. What makes you believe that Bay Area Alt-A owners will be totally different?
Gdog – bad analogy. Also, you are misplacing the blame.
Buyers and lenders alike were awash with the “prices will go up forever” mindset. Everyone should take their medicine, borrowers, brokers, and lenders. Also, be careful about who is “dumb.” Most borrowers have no financial education or understanding whatsoever, and rely heavily on the broker and lender for sound guidance. Sometimes to their detriment.
The GFE argument is a red herring. The GFE is usually included in a closing package that is some 40-50 pages long. Most times, people sign where the “sticky arrow” says “sign here.” You really expect the general populice to understand what that thing says or even read it? In fact, many brokers relied on the fact that buyers counldn’t understand the GFE for their own financial gain. I saw a GFE the other day with $34K in brokerage fees on a $400K loan.
If anyone is to blame it is those professionals in the industry that got their money and ran before this hit.
Of course, there are probably good brokers who go over the GFE line-by-line with the borrower to explain each and every charge so that the borrower is fully informed. In my experience, however, this is the exception and not the rule.
P.S. – thanks for the link Trip. I’ve been looking for a presentation like that.
anonm – I don’t necessarily think that the average Bay Area Alt-A buyer is better. I was just asking if tipster had any data that he was using or if he was just guessing (he’s probably right). Anecdotally, I don’t know anyone who took out an Alt-A loan who won’t be able to afford the reset, but I did know several sub-prime folks, so I was just curious if my anecdotal stuff was out there and strange (which it probably is)