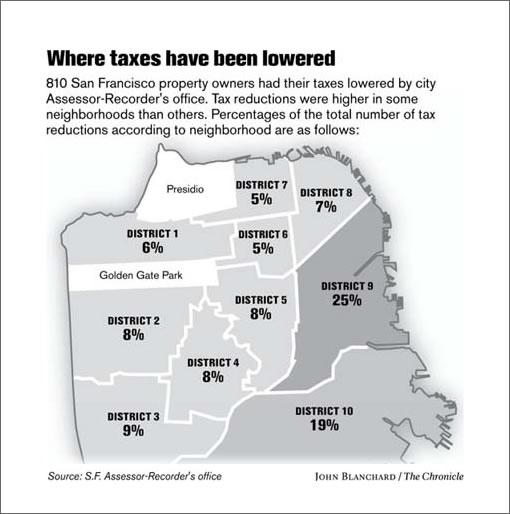
As a plugged-in reader points out, the Chronicle’s graphic (and story) to accompany the tax assessor’s 2008 granted reductions above, and and the stories of a number of plugged-in readers who either succeeded or failed below.
And yes, lot’s of biases but interesting nonetheless (if not only in terms of perception).
∙ Home-tax trims won’t hurt S.F., assessor says [SFGate]
∙ Average Granted Assessed Value Reduction In San Francisco: 11.5% [SocketSite]
It’s surprising that district 7, with less than 5% of SF housing, got 5% of the city’s reductions when that district is supposed to be holding up so much better than the others.
What this does not tell us is the extent of the reductions. A $20,000 and $200,000 drop in value are treated the same in this diagram.
District 9 — and its totally forseeable fate — reiterates so many fundamental rules of real estate that it’s hard to know where to start.
Maybe with that old addage, “Location, Location, Location”…
Or my father’s great advice: “Only buy where there are clear boundaries and very few new homes.”
Or maybe I just had to have enough meals and bar conversations to assess the type of people who use the term “up and coming” — precisely the LAST people from whom I wanted to take real estate advice.
Or maybe I just had to see the hideous buildings that were going up in Soma.
Or the joke locations, like Bluxome street, or any of the other junky back-alley condo locations that people were pretending to be “hip”.
Hmmm… I’ve ripped on Soma enough for now.
But, but,… how is this possible? I thought Real Estate only goes up in San Francisco. Where is our cheerleader in command Fluj?
It would would be interesting to correlate the reduction in each district to the asset appreciation over the last several years (at least since 2004) in each district.
Does anyone know where to get good data or already have the analysis?
@ tipster: I wonder if part of the reason D7 accounts for 5% of the reductions with less than 5% of the population is this: the home owners in this district are more savvy and more likely to take advantage of a reduced tax valuation.
@NewBuyer: I get the “very few new homes” part, but can you clarify the “clear boundries” part? What would be an example of this? Thanks.
Some of this can be attributed to the fact that a lot of buyers in district 9 bought recently, at least in comparison to people in district 1 or 7.
people who bought in 2006 are much more likely to get a reduction than people who bought in 1988
@gmlight
If they’re so savy in D7 why did so many of them buy homes in a liquifaction zone?
And are your really making the assumption that people in D7 are smarter than the rest of the city? Is that because they have more money? Are they getting dumber now that their stock portfolios are down 30%?
Where is our cheerleader in command F**j?
He was not a cheerleader per se. No pom-poms, no short skirts, even though he was bashing the other team to a pulp.
To his credit, he acknowledged the downturn did exist. Just that it was localized to sub-prime clientele area and that it would not spread to more prime RE.
Will the downturn affect the creme of the creme? I do think so. A lot of money has been going up in smoke these past 2 weeks, it’s gotta have to leave a mark. But you never know in this crazy/fantastic city.
@gmlight: The rule of only living where there are “clear boundaries” is a great one that my father taught me. It’s a little subjective, but generally holds. Some parts of a city, especially desirable ones, have very distinct boundaries. For example, nobody disputes where Tribeca (in NY), Lincoln Park (Chicago), or Old Montreal (MTL) begin and end. If you are in Manhattan and tell somebody that you live on “the upper east side,” when you live below 59th street, they will probably chuckle. It’s just so clearly defined.
In SF we have the same thing. If you live on Post and Laguna and tell someone that you are in “Pac Heights”, they will know you’re lying. If you live a few blocks below Broadway, you don’t live in Russian Hill. It’s really that simple.
The same is NOT the case with Soma. It’s just too damn poorly defined. And Southbeach specifically is also a bit hazy, since it’s a new term. The SOMA Grand is technically in Soma, I think, but come on, its location is much worse than other parts of Soma.
While it’s true that some parts of Pac Heights or Russian Hill are better than others, it’s not the sort of complete night/day difference as you will see in the large swath of land known as “Soma”.
Hrmph, now I see my problem, I am in one of those 5% districts (D6). If only I had bought one of the places I looked at in Districts 9 or 10 I might have gotten my assessed value reduce. Oh wait, nevermind.
i thought the boundary was california?
Can anyone explain why the district boundaries shown are so much different that the SF supervisorial districts?
For eg this District 9 includes both Dist 6 (SOMA) and 9 (Mission) in supervisorial districts (see http://www.sfgov.org/site/bdsupvrs_index.asp for all)
“And Southbeach specifically is also a bit hazy, since it’s a new term.”
South Beach is the are bordered by Market to the north, the Embarcadero to the East, McCovey Cove to the South and 3rd Street to the West. Because it’s new it’s clearly not as well known as [say] the upper east side, but that is to be expected.
@huh?
Go on Craigslist and see how many apartments and homes use the term South Beach that are not in that distinct area.
I guess sometimes people throw out the same crap with Nob Hill, etc, but I think all of this is much worse with Soma… and I think that everyone else knows that, whether they are defensive about it or not.
District 9 includes Inner Mission, Bernal Heights, Central Waterfront. I am suspecting that a cursory review of the sales in these areas by the assessor’s office must have included quite a few foreclosures in these areas. In addition, there were a lot more sales in Mission Bay, SOMA and South Beach in between 2005 and 2007 than other districts. I think all these contributed to a higher blanket reduction rate adopted by the assessor’s office.
District 9 includes Inner Mission, Bernal Heights, Central Waterfront. I am suspecting that a cursory review of the sales in these areas by the assessor’s office must have included quite a few foreclosures in these areas. In addition, there were a lot more sales in Mission Bay, SOMA and South Beach in between 2005 and 2007 than other districts. I think all these contributed to a higher blanket reduction rate adopted by the assessor’s office.
Ooops, I misread the article, the percentages refer to the number of reassessments, not the rate of reduction. Never mind.