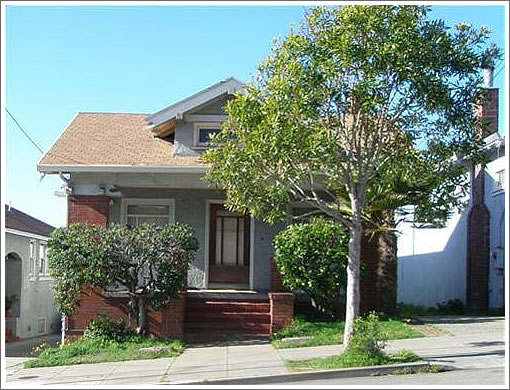
While we’ve only seen the pictures, we do like what we see in terms of bones, wood work, and potential (at least superficially). And yes, at the very least we’d budget for an eventual overhaul of the kitchen, bath, and backyard.
∙ Listing: 731 44th Avenue (2/1) – $699,000 [MLS]
Yes, just going by the pictures, it looks like a decent starter home.
However, we’re not fans of streets with non-grounded utility/telephone wires. Seeing as how the city’s Utility Undergrounding funds are already tapped out, this street will likely have above ground wiring for many years to come. Some might like it, while others will be bothered by this constant eyesore.
Damn SF Bubbs, update your blog much?
It’s nice to know that a “starter home” in the fog belt with only two bedrooms is going to cost $5000+ out of pocket every month.
After tax deductions, and assuming 2.5% annual appreciation and five years of ownership, you can hopefully knock that down to $2200 a month, but I’m not too confident that the outer sunset can sustain even modest appreciation over the next five years. Consensus now is there’s a recession on the way, and it’s looking like a nasty one. With pretty painful depreciation now popping up all over the city (see my post on this subject here: http://submedian.blogspot.com/2008/01/whats-diff.html) I would be very nervous as a young family about making a committment to a 2 bed 1 bath at this price point. Even if it is Arts & Crafts. Cuz you don’t want to spend a decade in that joint waiting for things to turn around.
Oh and here’s the figuring:
http://spreadsheets.google.com/pub?key=pM4Gw0s2zSeDRCwWixLHsCA
As always, I welcome feedback and suggestions for ways to improve the cost of ownership calculator.
Missionite,
Hi. We’ve actually developed a spreadsheet calculator to compare the rent vs. buy question. One thing people should realize is that the rent vs. buy decision is always dependent on when the crossover point happens.
In SF, if one looks at the rent vs. buy decision in Years 1 or even Year 2…..then renting will always come out ahead of buying:
Rental costs: Annual rent
vs.
Buy costs: Mortgage + Property Tax + HOA/maintenance – Mortgage_Tax shelter_amount
Delta = Rental Costs – Buy Costs
For this scenario, at $699K purchase price with 20% down, at 6.875% rate, and assuming you could rent this property for say $3000/month…..you are looking at an annual deficit of ($10.5K) when buying.
Over time, this gap will decrease. Assuming a 1.5% avg. rental appreciation, the annual deficit will still be ~($6.2K) in year 10!
However, there is hope. Even with a very conservative low home appreciation rate, one can right side the net effect OVER TIME….of course make sure you include the selling commission in this calculation.
The question is when will this crossover point happen. In above scenario, with a 2.0% home appreciation rate and a 1.5% annual rental increase………..you will lose money if you sell in the first 4 years. For example, if you were to sell the house in 2010 (living in 2 years), the total net effect from buying vs. renting would be a loss of $26.9K. However, by year 4, this loss is cut to $2.4K. And starting in year 5, you are generating postive paper gains.
We’ll try to upload the spreadsheet, or at least a screenshot of this, as it’s too complicated to explain in text.
Depending on the purchase price, these crossover points can drop to as soon as year 2 to all the way out to year 9/10 (say for a $899K purchase price with $140K down).
We have ours in Excel and will figure out a way to port it to a link somewhere.
Cheers
SF Bubble
BTW, this property is Outer Richmond and not Outer Sunset………not that there is much difference…… j/k to those that live in the Avenues! =)
Is this a good price in that neighborhood?
Hi SF Bubble,
It’s not clear from your post if you noticed that the link I gave *is* a rent vs. buy spreadsheet calculator. I’ve been working on it for a while now, and have had a lot of help and input from people here on Socketsite, The Front Steps, and elsewhere. It contains a lot of default numbers that are specific to SF (i.e. property tax rate, rental increase rate, etc.). You should click on it, as I think you would get a kick out of it, having done something similar.
In addition to calculating everything you describe, I also examine carrying costs, tax deductions (both standard, and capital gains) and lots of other nibblets. Good times…
We must be thinking along the same lines, because I show the “break even” point to be about five years as well.
I would love to check yours out as well, as I am always looking for ways to improve and refine my own.
You can do what I did and import your excel spreadsheet into Google Spreadsheet and then publish it, which will give you a link. Post the link and then voila, everybody can check it out.
There is no question that even with with a low appreciation rate you can net positive cash flow “OVER TIME” as you artfully put it. But the real questions are:
a) How long will this take, and can you afford to live there that long? What if there is a period of time of depreciation? How long will it take you to recover your loss?
b) How does this net positive cash flow stack up against other potential investments? As the NYT calculator is adept at showing, there are many potential scenarios, particularly in SF, where even a modest appreciation will NEVER catch up with the carrying cost and what you could have done with that money otherwise. In other words, barring some emotional or personal reason for owning a specific property, it doesn’t make any sense to buy it.
SF Bubble — missionite’s comprehensive spreadsheet does the very same thing you note re the rent-vs-buy analysis over time. Notice that he included 60 months in the “time period owned (months)” cell — but you could put whatever number you wanted in there to see the analysis over that selected period.
Note that his analysis also included an assumed $3000 rent for this place which appears quite high for that neighborhood but also assumed limited rent increases due to rent control, which would not apply to a SFR.
Missionite –
I think your spreadsheet is great. But something that needs to be stressed is that in your example the renter only saves $500/month, versus the owner who has to shell out roughly $2000/month more than renting.
Also, where is the $2200 month figure you mention on your spreadsheet? 5 years from now it will still be $5000/month.
Hi Blaise,
There used to be a formula there instead of that $500 (the formula is [the sum of all the monthly ownership expenses]-[tax savings]-[total rental expenses divided by total number of months]=out of pocket differential between owning and renting.). The true spread is actually a little wider then this: since you only have to pay property tax twice a year, you can presumably invest the property tax payments on an accrual basis for six months and keep the interest.
I must have typed in a number at some point and forgotten to replace it with the formula when I was done. Great catch, it’s fixed now.
In regards to your second question, I am referring to cell F66 (which currently stands at $2212.41), which is the final monthly cost of ownership ammortized over the lifespan of the ownership period assuming a 2.5% annual appreciation, and a 5% selling commission.
The $5000 a month “out of pocket” figure refers to the money you have to pay out of pocket every month to keep the ship afloat, but that’s not the end of the story. Remember you get a lot back in tax savings and equity. But you can’t use tax savings or equity to put food on the table in the short run, so your short term out of pocket is $5k. Once you have sold the house and pocketed your tax savings and (presumed) appreciation and equity, your true monthly cost is closer to $2200. Let me know if that isn’t clear…
Thanks Missionite.
It is not $5000/month out-of-pocket – more like $3800. Now I see what you are saying about the $2200/month after all is said and done.
But renting is a better deal if you invest the $800/month above your rent, effectively reducing your rent.
Love the What’s the Diff?
Cheers
“It is not $5000/month out-of-pocket – more like $3800.”
How do you figure?
Mortgage: $3777.17
Property Tax: $661.14
Homeowner’s Insurance: $267.95
Maintenance: $582.50
Total monthly out of pocket (before tax deductions): $5288.76
What I was saying was that you clued me into the difference between the $5288.76 figure (roughly $5000) and the $3645.66 (roughly $3800) – the diff is the tax deductions.
Right on. Keep up the good site.
Does anyone know what happened to this place? It’s no longer listed.