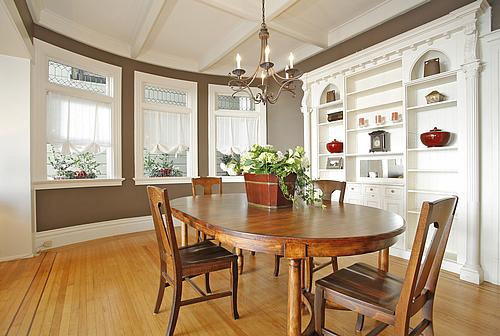
Last October, 2929 Fillmore sold for $1,425,000. Last month, the condo hit the market for $1,475,000. Last Friday, the price was reduced to $1,435,000.
In no way, shape, or form are we suggesting that anyone should evaluate a real estate investment based on a one year return. We are suggesting, however, that same home sales – assuming no remodeling or renovation between those sales, or significant changes in the neighborhood – can provide a relatively good measure of actual market appreciation (unlike changes in “Median Sales Price”). Now we just need some more data points.
∙ Listing: 2929 Fillmore (2/2) – $1,435,000 [Virtual Tour]

Excellent approach. There is an index calculated using exactly this same approach (S&P Case-Schiller Index). They look at many metro areas, including San Francisco, and look for repeat sales of homes that have not been significantly changed. Unfortunately it’s on a 3-month delay and comes out the last Tuesday of every month. If anyone is interested, you can check out http://www.macromarkets.com for more info. This is coincidentally what the real estate futures that trade on the Chicago Mercantile Exchange are based off of.
Yea, but! The same unit sold for:
12/18/97 $550,000
06/22/01 810,000
10/01/04 1,100,000
10/26/05 1,425,000
I guess no one wants to stay there…
Ouch. 86k in realtor commission, plus 18k in transfer tax, another 18k in property tax paid, plus intrest (accrued or lost) over the past 12 months. That’s $125k in lost value to the seller of this property. This assumes it sells for $1.435M.
Probably could have rented the same place for $5k a month.
Except for the lucky seller who bought and sold in 04 – 05, its risky to buy and sell in one year no matter what the market is doing.
This discussion brings to mind this totally unsupported by any facts idea I have that, to paraphrase, “over time, 80 percent of real estate activity is concentrated in 20 percent of the available properties”. Has anyone ever analyzed the market like this?
I am a long time resident of one neighborhood in San Francisco. Some properties seem to have agents for sale signs on them more often than not, where the rest seem to stay with one owner for generations.
This ties into unanother unscientific observation: Often the properties that turn over frequently are second class in some measurable fashion to the seldom sold properties. The bottom line in my ‘hood is: solid pieces of architecture that last sold in 1990 for $250K versus damaged goods that sold in 1998, 2001, 2003 and finally 2006 at 10 times 250K. The typical victorian on my street that is listed in the AIA guide to significant architect has a seventies p-lam kitchen; the asbestos shingle ruin next to it is all granite and stainless steel.
This isn’t likely to even get the asking price. Check out 2143 Bay Street. Offerred at 1 449, it is a top floor (not ground floor) with a sunroom (as opposed to no sunroom)and 2 car parking (not one).
This place should be 100K under that one, not 14K.
Interesting that you bring up 2143 Bay, seems like a good property at $1,300,000.