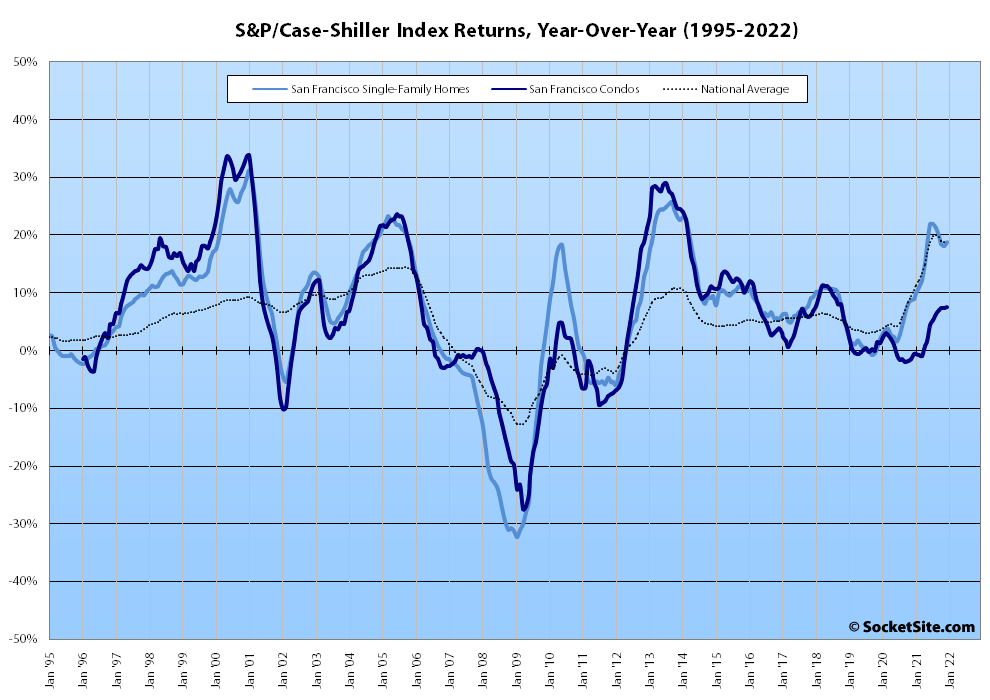
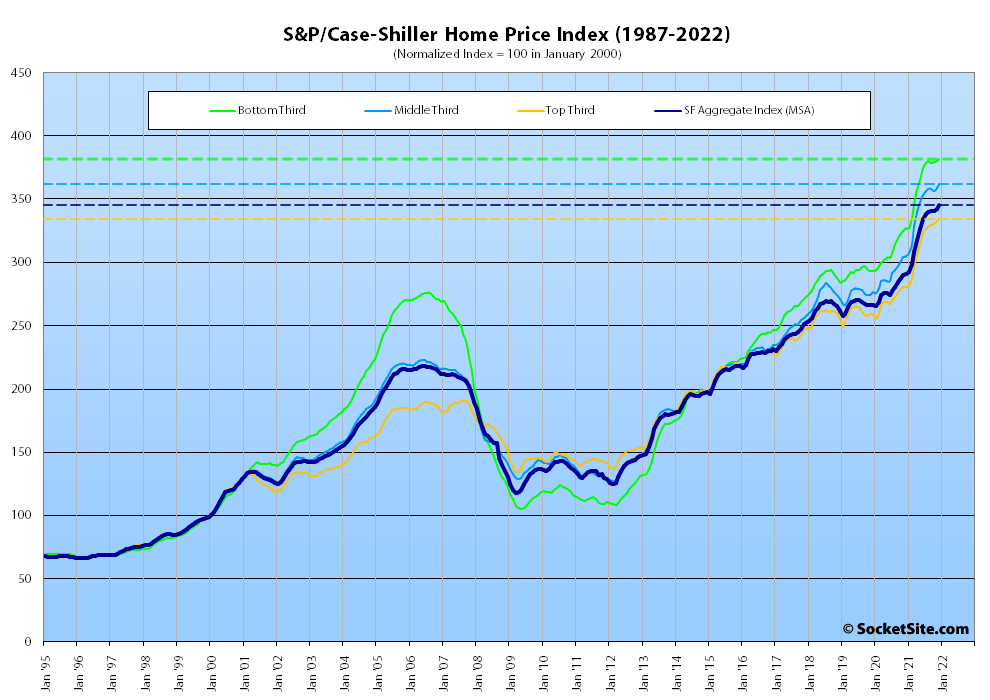
Having inched up an upwardly revised 0.6 percent in November, the S&P CoreLogic Case-Shiller Index for single-family home values within the San Francisco Metropolitan Area – which includes the East Bay, North Bay and Peninsula – gained 0.8 percent in December to end the year up 18.8 percent, matching the national average and having decelerated from 21.9 percent year-over-year gains in June/July.
At a more granular level, the index for the least expensive third of the Bay Area market inched up 0.4 percent in December for a year-over-year gain of 16.8 percent, which was down from a 23.4 percent gain in June; the index for the middle tier of the market ticked up 1.1 percent in December for a year-over-year gain of 18.8 percent, down from 23.7 percent in June; and the index for the top third of the market inched up 0.4 percent in December for a year-over-year gain of 19.1 percent, down from a 21.1 percent gain in July.
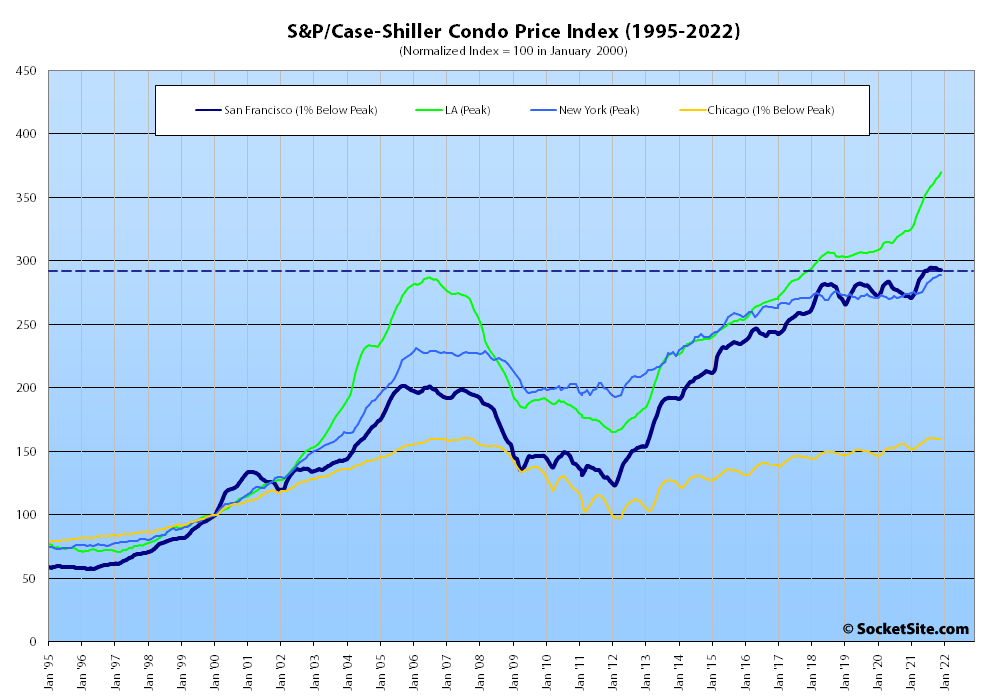
The index for Bay Area condo values, which remains a leading indicator for the market as a whole, was unchanged in December, having slipped (a downwardly revised) 0.5 percent in November, for a year-over-year gain of 7.5 percent (versus 14.4 percent, 3.9 percent and 9.1 percent in Los Angeles, Chicago and New York respectively).
And nationally, Phoenix still leads the way in terms of indexed home price gains, having increased by 32.5 percent in 2021, followed by Tampa (up 29.4 percent) and Miami (up 27.3 percent), with an average indexed gain of 18.8 percent, which was unchanged from November.
Our standard SocketSite S&P/Case-Shiller footnote: The S&P/Case-Shiller home price indices include San Francisco, San Mateo, Marin, Contra Costa and Alameda in the “San Francisco” index (i.e., greater MSA) and are imperfect in factoring out changes in property values due to improvements versus appreciation (although they try their best).


This is totally normal and to be expected — if fact its an iron-clad right of all property owners (especially those of the Nimby persuasion) — and has absolutely nothing to do with the fact that we continue to have a chronic housing shortage because the economic principle of supply-and-demand cannot possibly apply to the unique product of housing.
Signed, John. Q. Nimby, Property Owner.
“Phoenix still leads the way in terms of indexed home price gains, having increased by 32.5 percent in 2021, followed by Tampa (up 29.4 percent) and Miami (up 27.3 percent)”
Guess the NIMBYs are worse in Phoenix, Tampa and Miami…where they have been building more housing and prices are up more than here…
The policies enacted by NIMBYs in places like the Bay Area and Los Angeles (over the past 4+ decades) have resulted in a chronic and continuing housing shortage throughout coastal California.
This has ultimately reached a crisis point– exacerbated by the Covid pandemic — that is now causing people to move to Phoenix, Tampa, Miami, Spokane. Accordingly, the sudden/substantial influx of new residents to these areas is resulting in spiking prices there as well.
Where might be this “Los Angeles” of which you are speaking?? It certainly can’t be the one in Los Angeles County which has grown by ~50% over this period…
I find this comment: “The index for Bay Area condo values, which remains a leading indicator for the market as a whole” interesting. It feels correct, but the overlaid chart of BA SFH and BA Condo Price Index seems to show a mixd bag of SFH leading, condos leading, and them moving in lockstep.
It must mean the editor thinks the market as a whole will see a year-over-year gain of 7.5 percent going forward.
That’s incorrect. Our focus is on direction and velocity, not the absolute return.
We’d look at the derivatives of the two indexes themselves, not their relative year-over-year returns.
That being said, while the condo index ended the year up 7.5 percent on a year-over-year basis, 98 percent of that gain occurred in the first half of last year and the index has actually slipped a percent since August.