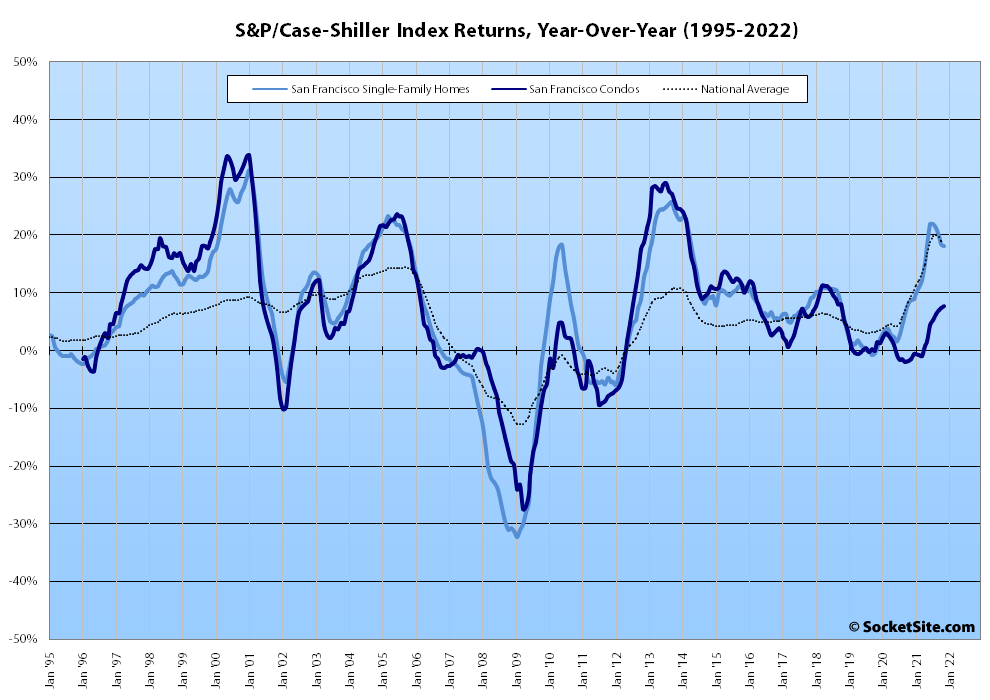
Having held in October, the S&P CoreLogic Case-Shiller Index for single-family home values within the San Francisco Metropolitan Area – which includes the East Bay, North Bay and Peninsula – inched up 0.6 percent in November for a year-over-year gain of 18.2 percent, which was down 3.7 points from July and 0.6 percentage points below the national average.
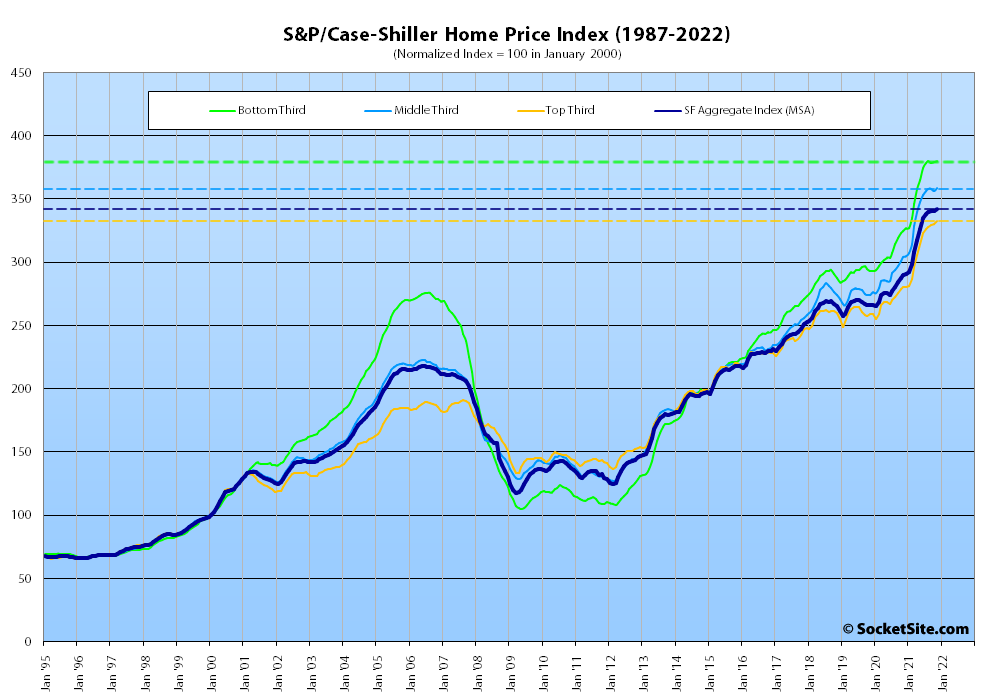
At a more granular level, the index for the least expensive third of the Bay Area market inched up 0.3 percent in November for a year-over-year gain of 17.0 percent, which was down from 23.0 percent in July; the index for the middle tier of the market inched up 0.6 percent in November for a year-over-year gain of 17.7 percent, down from 22.4 percent in July; and the index for the top third of the market inched up 0.6 percent for a year-over-year gain of 18.8 percent, which was down from a 21.0 percent gain in July.
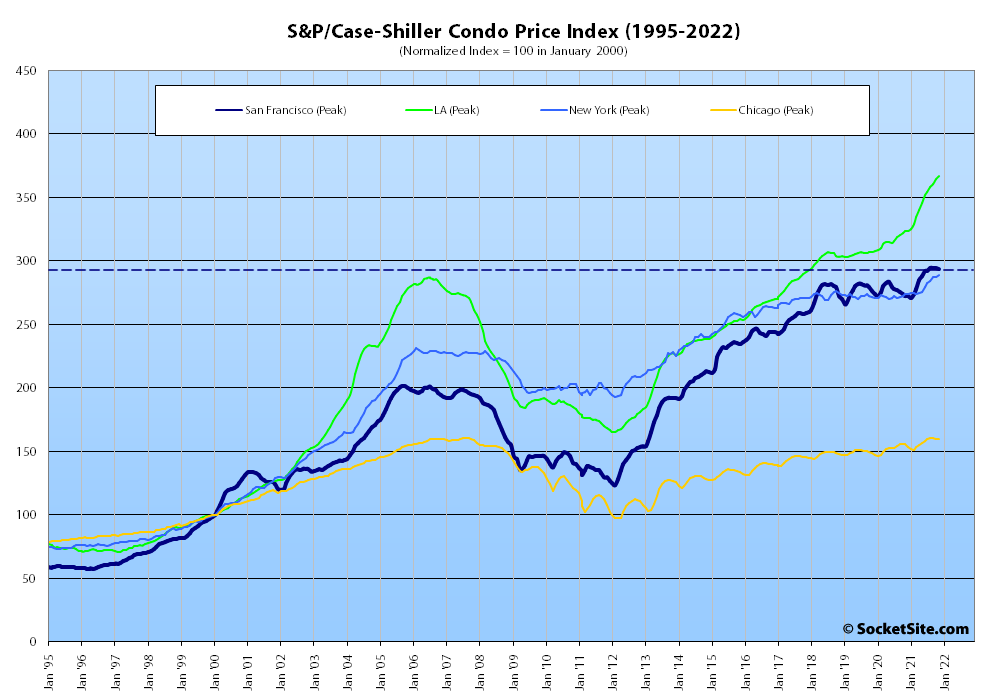
At the same time, the index for Bay Area condo values, which remains a leading indicator for the market as a whole, slipped 0.3 percent in November for a year-over-year gain of 7.7 percent (versus 13.4 percent, 2.7 percent and 5.4 percent in Los Angeles, Chicago and New York respectively).
And nationally, Phoenix still leads the way in terms of indexed home price gains, having increased by 32.2 percent over the past year, followed by Tampa (up 29.0 percent) and Miami (up 26.6 percent), with an average indexed gain of 18.8 percent, having ticked down from 20.0 percent in August and slipped from 19.0 percent the month before.
Our standard SocketSite S&P/Case-Shiller footnote: The S&P/Case-Shiller home price indices include San Francisco, San Mateo, Marin, Contra Costa and Alameda in the “San Francisco” index (i.e., greater MSA) and are imperfect in factoring out changes in property values due to improvements versus appreciation (although they try their best).