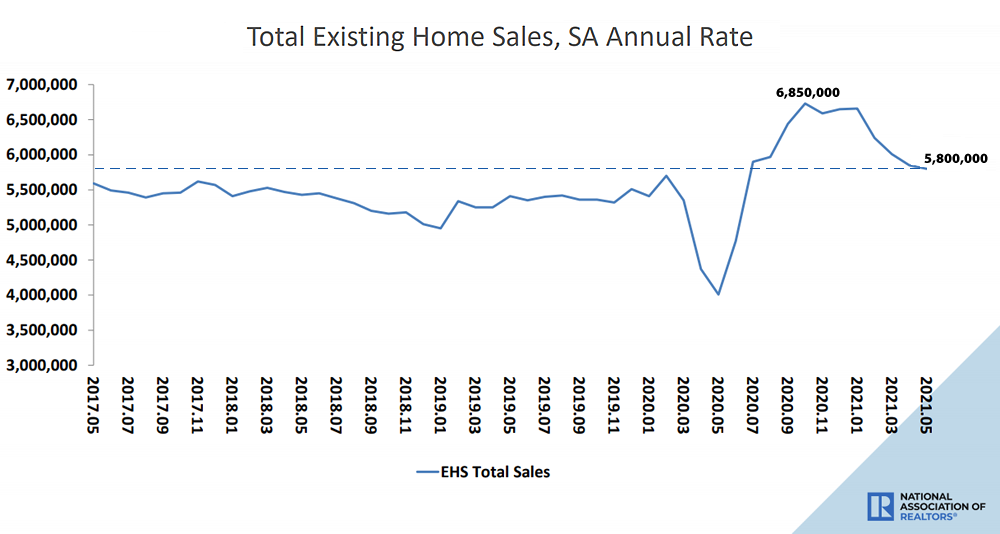
Having slipped another 0.9 percent in May, the seasonally adjusted pace of existing-home sales across the U.S. has dropped to an annual rate of 5.80 million sales, which was 44.6 percent higher than in May of 2020, when pandemic-driven stay home orders were still widespread, but down 15.3 percent over the past six months to an eleven-month low, according to data from the National Association of Realtors and which shouldn’t catch any plugged-in readers by surprise.
At the same time, listed inventory levels across the U.S. actually ticked up another 7.0 percent to 1.23 million homes on the market, net of new sales, but were still 20.6 percent lower than at the same time last year, when pandemic-driven stay home orders were still widespread and versus 8 percent fewer in San Francisco.
And while the median existing-home sale price ticked up another 2.5 percent April ($341,600) to May ($350,300) and was 23.6 percent higher than at the same time last year, the increase continues to be driven by a dramatic change in the mix of what has sold versus underlying, and widely misrepresented, “appreciation.”

the graphs show sales units by price bucket, but do you have avg price of sale unit by price bucket to show as well. this would show us the price change at the price bucket range. this would “unadjust” for mix.
NAR doesn’t provide that breakdown. But as a reality check, while “the median existing-home price for all housing types saw a record year-over-year increase of 23.6% in May 2021,” the Case-Shiller index for home values nationally was up 13.2 percent through March (at which point the “median existing-home price” was up 17.2 percent YOY).