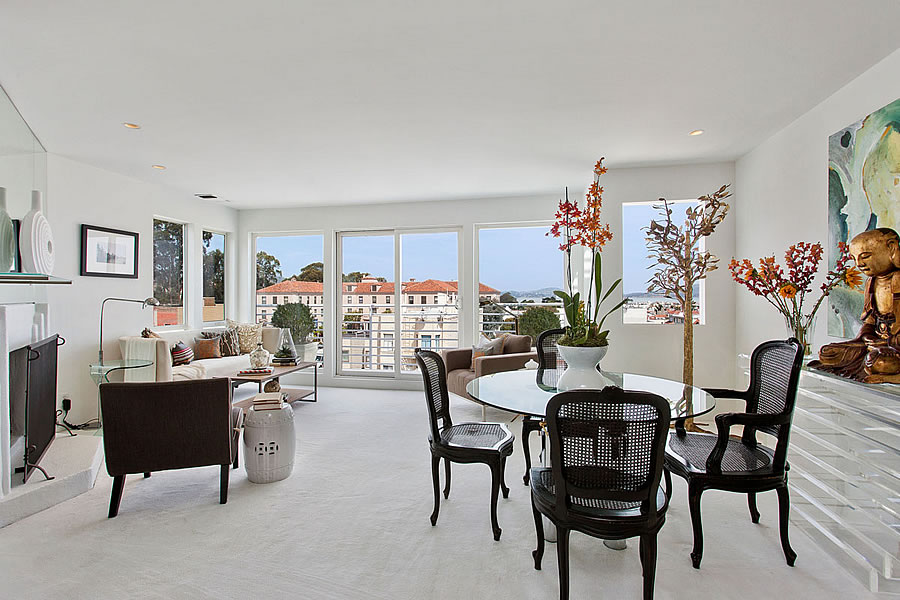
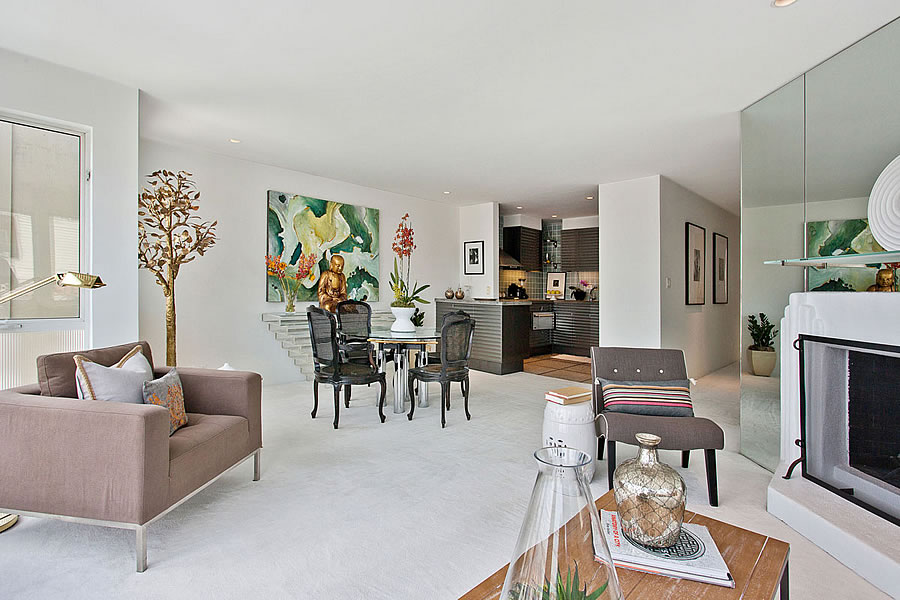
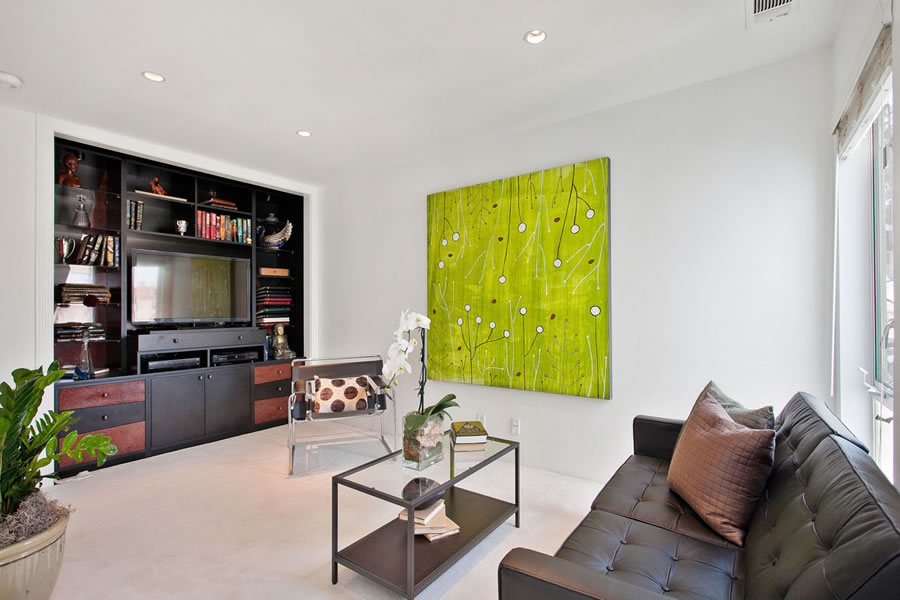
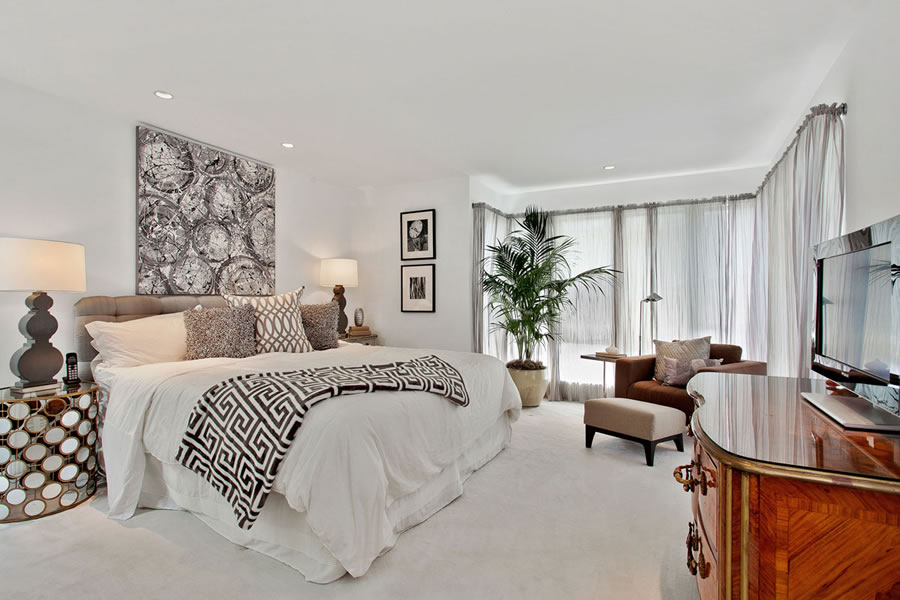
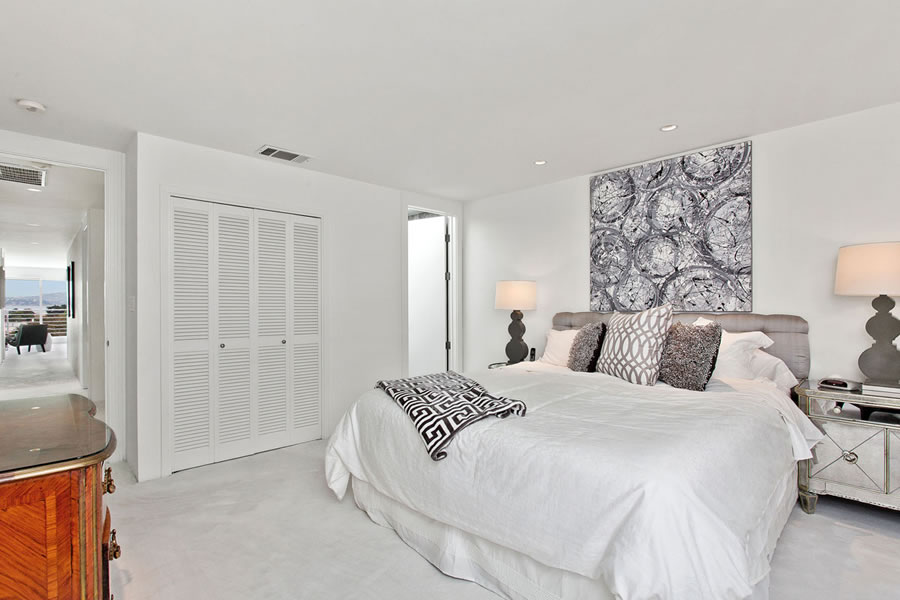

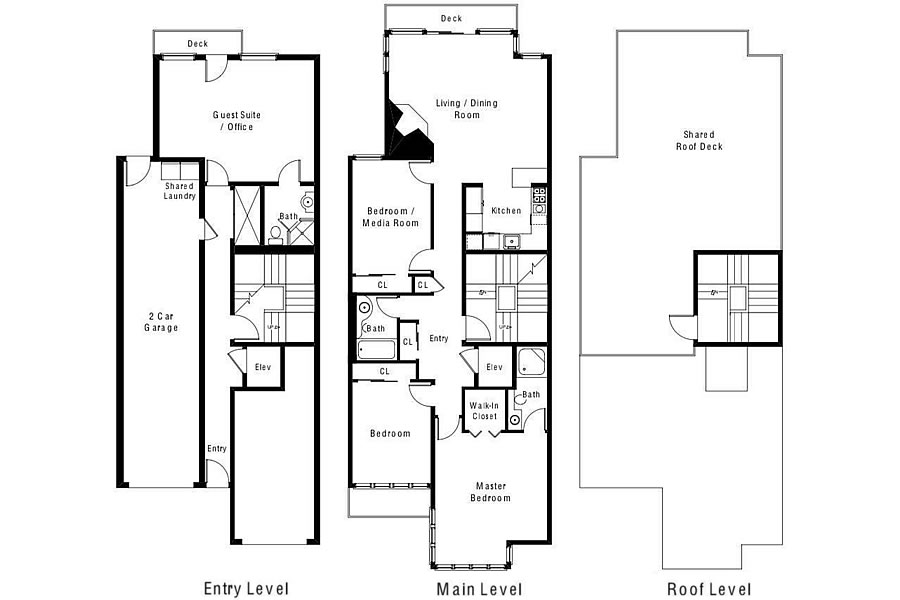
Purchased for $2.2 million in June of 2014, the top floor Cow Hollow condo at 2820 Greenwich Street is outfitted with three bedrooms two baths, and two car parking, with direct elevator service to the unit and a bonus office/guest room with a full bath on the ground floor of the three-unit building.
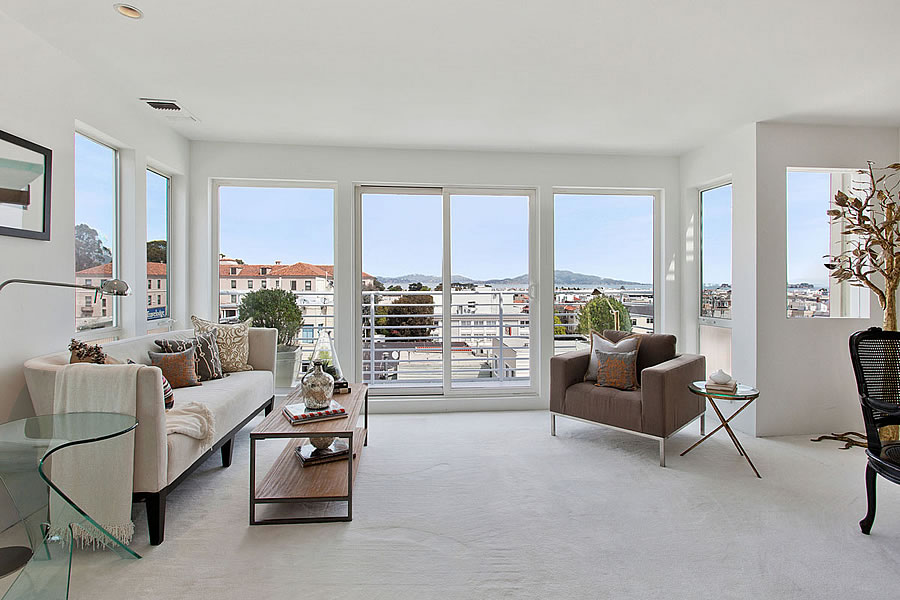
In addition to rooftop and Bay views, the “unbelievably bright” unit offers an “un-matched” location, “a half block from the gorgeous grounds of the Presidio, and just steps to the delightful boutiques and cafes on Chestnut and Union Street,” and HOA dues of $500 a month.
And having returned to the market priced at $2.45 million this past September, a sale at which would have represented total appreciation of 11.4 percent over the past five years for the unit, and then having been reduced to a “BUY NOW” price of $2.195 million in November, the re-sale of 2820 Greewhich Street #3 has now closed escrow with a contract price of $2,072,500, down 5.8 percent versus the second quarter of 2014 on an apples-to-apples – versus “median price” – basis.
An article in the NYT (see “The Decade Dominated by the Ultraluxury Condo”) this weekend on the wealth of unsold condos in NY (something like 50% of all condos built since 2015 remain vacant/unsold) puts these SF numbers in perspective. Lots of sales much lower in the secondary market.
How many new condos remain unsold in San Francisco? Plenty of big name developers in NY seem to be riding stifling holding costs at present.
But weren’t SF realtors telling us that $2M+ was the one bright spot in an otherwise declining market? Almost 6% below 2014 is crazy compared to how hot the market used to be.
Early 2019: When Uber and Airbnb Go Public, San Francisco Will Drown in Millionaires
“One recent night, in a packed room with a view of the Bay Bridge and an open bar, real estate investors gathered. Standing at the front presenting was Deniz Kahramaner, a real estate agent specializing in data analytics at Compass.
“Are we going to see a one-bedroom condo that’s worth less than $1 million in five years?” he asked the crowd. “Are we going to see single family homes selling for one to three million?”
No, he said, not anymore. The energy rose as he revealed more data about new millionaires and about just how few new units have been built for them. San Francisco single-family home sale prices could climb to an average of $5 million, he said, to gasps.”
“Even if just half the I.P.O.s happen, there’s going to be ten thousand millionaires overnight,” said Herman Chan, a real estate agent with Sotheby’s.”
Flash forward a year…
Please take you shoes off before entering! I’ve never seen so much white carpeting.
This looks like a good deal. 4 bedrooms for ~2M
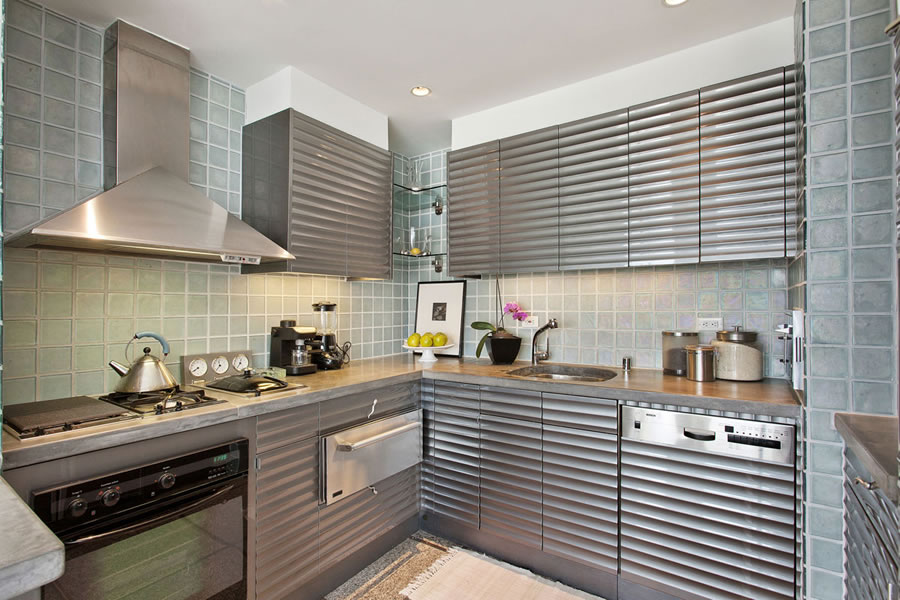
those are some ugly cabinets
FYI- The buyers agent did not take the 2.5 percent commission and put it towards the sale price. $2,126,812.40 less 2.5 percent
I’ve toured this unit – the kitchen needs a complete remodel, and the bathrooms are a bit dated as well. I also don’t how they’ve been getting away with calling it a “roof deck” – you have access to the rooftop – big difference. And wall to wall carpet? No thanks. And the carpet in the “guest suite” is even worse.
Inflation since 2014 has totaled 8.6%. That’s a 14.4% real drop which could easily pay for new carpets.
You left out, “that’s not the real Cow Hollow.”
I live nearby and it’s absolutely one of my favorite parts of San Francisco due its proximity to The Presidio.
The discussions aren’t quite there yet but are beginning to resemble the softening of past cycles. In past cycles, it was a different version of the same thing: with the early apples, it was always about things that were wrong with the unit (even though they were apples) and then reaching further and further to explain away the growing pool of down apples. Then it was about how softening was just in the outer bay area counties, then other places but not SF, etc. It’s funny how some who denied that any softening was going on at the time, now talk about what a great time it was to buy in the last downturn. This time around, it’s about condos vs SFH’s- (which makes sense), or how it’s just SOMA, etc.
What happened to pull out of past events? Each time the market was saved by larger and more extreme and experimental Fed actions. After the dot com crash, the Fed lowered Fed funds to a then-unheard of 1% and when rates bottomed, the proliferation of affordability mortgage products started. In 2008-2009, the Fed took rates to an unprecedented 0% and then did $4.5T of QE. It saved not just the housing market but all risk asset classes. For housing, it wasn’t just bailing people out or making monthly mortgage payments cheaper. It caused institutions including pensions to have to reach for yield outside of fixed income. It flooded VC’s with money and got a lot of profitless companies funded in the bay area. It created stock market wealth. Everything, including SF housing, rallied. Buy the boring SP500 at the low in 2009 and you are up almost 5x now.
This time around, what will the Fed do? Each move has been larger and more experimental ever since the 1998 crisis when the Fed eased 75bps between meetings (and each crisis has been successively larger as well). The Fed has already re-eased and ended the balance sheet run-off. And while I’m sure there are some up apples right now, it’s hard to argue that housing is strong- despite stocks being at record highs, tech doing extremely well, bay area big tech doing extremely well, lower rates, and … ummm, those IPO’s.
Condo prices per square foot are up year over year though, per the MLS. In 2018 it was $1111/ft. In 2019 it was $1134/ft. SFRs even more so, @ $992/ft in ’18 and 1013/ft in ’19.
We all know this site only rates apples, but that’s what people in the market were facing.
Relying on MLS-based averages without adjusting for changes in the mix of sales (size, location and age) can certainly lead to some erroneous conclusions about the overall state of the market. Heck, there were those who were convinced that sales volumes were trending up in 2019 (when they were actually down).
And of course, we not only track apples, but indexed values and medians as well.
Yes, and again, that’s true of every single year versus year, and large sample sizes variation.
Since when did apples account for age? Ha. Great one.
Single family home sales are down by ~2.5% year over year per the MLS, from a very robust 2018. Mea culpa, I should have factored in the cognitive dissonance between “the sky is falling” headers and echo chambers such as this website, and sticker shock for buyers in San Francisco.
…that’s true of every single year versus year, and large sample sizes variation
Unfortunately, that’s incorrect when the mix of what’s selling changes.
Since when did apples account for age?
Actually, they do. Typically, real estate isn’t a depreciating asset. And one of the keys to apples-to-apples comparisons is comparing the same era assets to themselves.
Single family home sales are down by ~2.5% year over year per the MLS
Whatever happened to “condos may be down, but single-family home sales will be up, you’ll see”? Regardless, we (still) wouldn’t hang our hats on MLS-based sales data. But at least you’re now directionally correct.
And while you might characterize an accurate forecasting and accounting of sales and/or prices trending down as “the sky is falling,” versus more perfect information to inform one’s understanding of the actual market and plans, we don’t.
You still keep saying prices trending down for some reason. It’s an odd broken clock that you cling to, but it’s yours all right.
I think the difference of opinion is that Ohlone is looking at bulk overall trends as going up and Socketsite is looking at apples going down. The latter is a better indicator of where the intrinsic market is moving.
If you buy a house for $1M, install a $500K solid gold toilet, and then sell that same house for $1.5M then that does not indicate that the value of the house itself went up 50%. Yet that is what you conclude by looking at bulk sales figures which include a lot of renovated and flipped homes.
Well, I’ll see your gold toilet and counter with 15 years out of date track lighting, outre cabinetry and fixtures on an “apple.” The notion that apples account for stylistic changes and tastes, and even superior technology appearing over time is a bizarre take. This is the flaw with being so narrow minded and virtuous about apples.
Case-Shiller looks at bulk overall trends and that is trending down too.
Everything gets dated. Every year everything gets one year older. Sometimes compounded market appreciation beats out dated fixtures, sometimes not. Thats what it means for a market to be trending up or down.
Big difference between buying a house for $1M, not putting a penny into it and getting an offer for $1.5M vs buying for $1M, putting in $500k of work and getting an offer for $1.5M
Yeah, I agree that age depreciates a home and that should be taken into account for apples. But appreciation generally cancels out deprecation, especially for short intervals between the sales being compared.
Upgrades to the latest greatest showy materials and appliances on the other hand have nothing to do with the intrinsic value of the property. Sure, you can say that there’s market demand for upgraded homes fueling aggregate increase in sales values. But there’s still plenty of un-upgraded properties to choose from for those who don’t need the latest greatest. Including upgrades into bulk statistics just fogs the picture and makes it harder to understand how the market for raw property is really behaving.
Apples indicate how raw property values are behaving. Bulk sales statistics are a combination of raw property (mandatory for all property sales) plus luxury bling (optional) are trending. For buyers who don’t care about having the latest greatest bling, what stat should they consult?
“Bulk sales statistics are a combination of raw property (mandatory for all property sales) plus luxury bling (optional) are trending.”
But the median isn’t even that. If low end sales volume drops more than luxury bling then the median will go up. The change in mix makes the median go up even if both luxury bling and non-bling properties are dropping apples to apples.
[Editor’s Note: The same goes for the average price per square foot as well.]
A lot of that is probably due, in part, to high end condos like the Avery. Part of the value of Apples to Apples comparisons is that it corrects for “new construction sells for more even if it’s not better due to a totally different buyer profile”.
Speaking of which, the Avery is one of the new developments in town which has quietly rolled out a series of recent price cuts.
The Palace went through some price cuts as well.
Is the Avery a mix of condos and apartment rentals? I see them have a link to luxury rentals available in the building.
Yes.
Does anyone know how many completed new condos remain unsold in San Francisco?
Well, not really. The moving target for what is “low end” needs to be accounted for there. For example, is Mission Terrace even low end at all anymore? You can’t touch anything for sub 1.2M there now and that has occurred over the past 18 months or so.
Ignoring the Mission Terrace properties which are currently on the market with sub $1.2 million price tags, keep in mind that the corner home with a permitted in-law unit at 99 Rotteck Street sold for $900K. Of course, that sale closed escrow way back in December of 2019, three weeks ago.
And if only there were some “apples-to-apples,” or indexed, way to account for those “moving targets” and shifts in mix…
The continual need to address my words, as you let others wax wildly hyperbolic unchallenged is not a good thing for you to be doing within this forum. Here we see you positing the 99 Rotteck property, an 1100 foot house on a 1250 foot lot as some sort of counter argument as opposed to a data point that affirms my take.