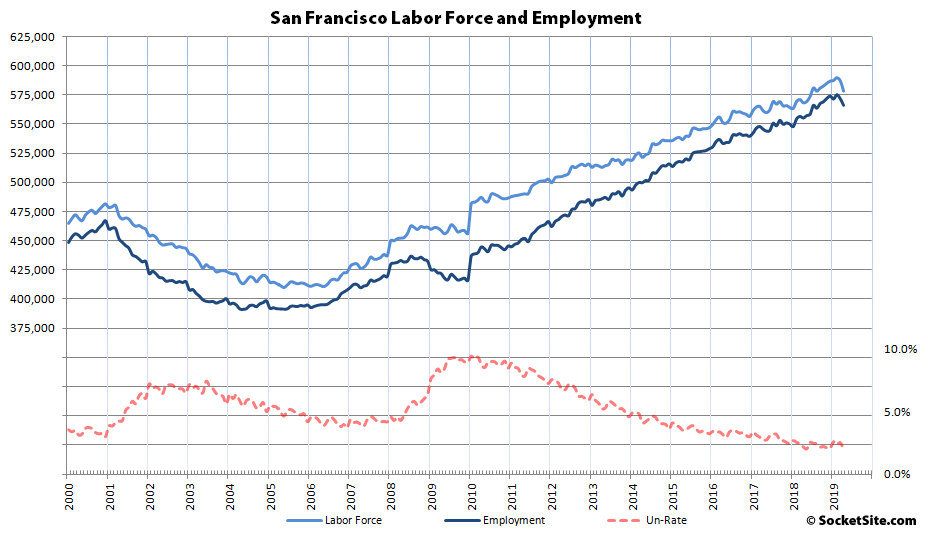
While the unemployment rate in San Francisco returned to a record low 2.1 percent last month, the drop was driven by a reduction in the size of the labor force and the number of people living in San Francisco with a paycheck actually decreased by 5,700 to 566,200, which is down 9,200 since February’s record high and versus an increase of 700 over the same period of time last year.
That being said, there are still 129,500 more people living in San Francisco with paychecks than there were at the start of 2010 and 10,800 more than at the same time last year. But as we first noted last month, the rate of change has actually turned negative over the past quarter.
In Alameda County, which includes the City of Oakland, the estimated number of people living in the county with a paycheck dropped by 7,400 over the past month and is down 11,200 over the past two to 821,500 but remains 3,700 above its mark at the same time last year and 128,700 more than at the start of 2010 and the unemployment rate has dropped to a near-record low of 2.7 percent.

Across the greater East Bay, including Solano County, total employment now totals 1,566,200, which is down by 13,000 over the past month and down 20,600 over the past two, while the unemployment rate has dropped to 2.9 percent. And while there are still 4,000 more employed people living in the greater East Bay than at the same time last year, the year-over-year gain has been on the decline since the end of last year, with last month’s gain the smallest since 2011.
Up in Marin, the number of employed residents decreased by 1,400 in March to 136,900, which is a nominal gain of 500 over the past year, while the unemployment rate has dropped to 2.1 percent.
And down in the valley, employment in San Mateo County decreased by 4,600 in April and is down 7,400 since February to 447,700 but remains 8,100 above its mark at the same time last year with an unemployment rate of 2.3 percent, while employment in Santa Clara County dropped by 8,600 and is down 13,100 over the past two months to 1,023,700, which is still 11,500 more than at the same time last year with an unemployment rate of 2.3 percent, resulting in a blended unemployment rate of 2.2 percent across Silicon Valley.

As such, the unemployment rate for the Bay Area as a whole has dropped to 2.4 percent with a total of 4,065,300 people employed. And while that’s still 33,800 more people with paychecks living in the Bay Area than at the same time last year, that’s 33,500 fewer than the month before and down 53,600 since February, versus an increase of 5,000 from February to April of last year.
So which graph is “greater” Fremont included in: Alameda County or Silicon Valley? or both? (HINT: what I’m getting at is consistent labeling – either all political/county or all conceptual – would be nice)
As part of Alameda County, and not traditionally “Silicon Valley,” Fremont is counted as such above.
Thank you; and it’s true that “traditionally” it was not, but I’ve heard it’s become a location for some tech firms and – even more so – a home for tech employees. So at some point it may be necessary to revisit this designation.
Unless of course one is metathesiophobic
🙂
[Editor’s Note: We’ve heard the same for San Francisco as well.]
On the recent deployment of the term “metathesiophobic” in common parlance — most likely driven by a smallish cohort of underemployed millenials with near-worthless debt-financed Grievance Studies BAs. Latching on to the fashionable craze for proving one is “not afraid” of anything by “embracing it” because it’s “different.”
Where’s the contrary faux-educated latinate term for fear of things NOT changing? A great many unchanging things are very valuable. Are metathesiophiles disturbed that the sun rises every day and gravity seems to keep pulling with ~10m/s2 acceleration century after century? There is nothing inherently laudable about change for change’s sake.
This across the board drop seems fishy. Is this possibly a data gathering/evaluating issue? I’m not sure if this is a 100% survey or some approximation. But it just seems strange….
Don’t like the gloom, huh? Well you’re in luck. (and no, there’s never been a complete explanation for these frequent good economist/bad economist differing stories)
We report employment in the absolute, not “seasonally adjusted” numbers, which is why we offer year-over-year and same period comparisons as well.
And while a seasonal adjustment can help smooth month-over-month changes, it can distort the underlying trend and more immediate changes at hand. Not to mention, in the context of real estate and demand, the actual number of people with a paycheck is more relevant than the theoretical number of people, having been seasonally adjusted.
And of course the Bay Area and (it’s sub regions) isn’t a “closed system”: i.e. people can have a job here and live in Lodi – we’ll skip the CCR editorial comment with regard to “living” there for a moment – or vice versa….which perhaps makes agonizing over changes that are little more than rounding errors – so far – a waste of effort.
Which is precisely why we track employment, not jobs.
This is a surprise number – a drop and not an anemic increase. It fits with the trend and coincidentally the population stagnation. Other metros in “greener” locals are continuing to see robust job gains. IMO the BA will not loose jobs or population but will not gain either significantly for the medium term future. Folks are leaving – everyone has their anecdotal story – I have a ton especially of seekers for a better life heading North to the Gold Rush City.
But, a different note. A long time pneumonia gulch coffee shop may close. The owner just bought a home in Arizona – way too hot I told him – and is set to move. He could not afford a home in SF (despite two jobs) and his young daughter is learning nothing in the public schools here. And he can’t afford a private school. It is bad enough being salaried in the BA, but being a small business person is prohibitive.
And way too dry, too…right ?? 🙂 Or it may become an Amazon depot or house an immigrant family of 18 or be reopened by someone with an (insertnamehere).com’ish business model (i.e. lose infinite money for years while you “build volume…after that profits are easy”). I think we all agreed a while back the retail leasing picture makes little sense: recently the DailyCal did a feature on retail (in Berkeley, natch) and two of the most widely cited complaints were increasing vacancies and…wait for it…rising rents; now what’s wrong with that picture ??
Hey, I told him to go North (young man) but he wouldn’t listen. Especially as UFO activity and Bigfoot are all over the NW. He is into that as the photos in his shop attest. Retail will change and shrink but not disappear. The proprietor has checked Arizona out and he claims things are better there for the small business person. No doubt.
What happened from the end of 2009 to the beginning of 2010? Looks like a measurement fluke.
Hmmmm: maybe this?
Usually when you see a discontinuity at a decade boundary it’s because of the Census, though why the jump would be backdated to the start of the year is a mystery. But yes, it’s reasonable to ask what is really being graphed here. Editor?
Looking forward, the GOP goal for the 2020 census is to intimidate undocumented immigrants out of official existence, so the population of SF (and CA) will be lowballed relative to the 2010 methodology (with a subsequent shift in national representation).
I hadn’t thought of that. If one was to not count all undocumented residents in San Francisco, the official population numbers will drop.