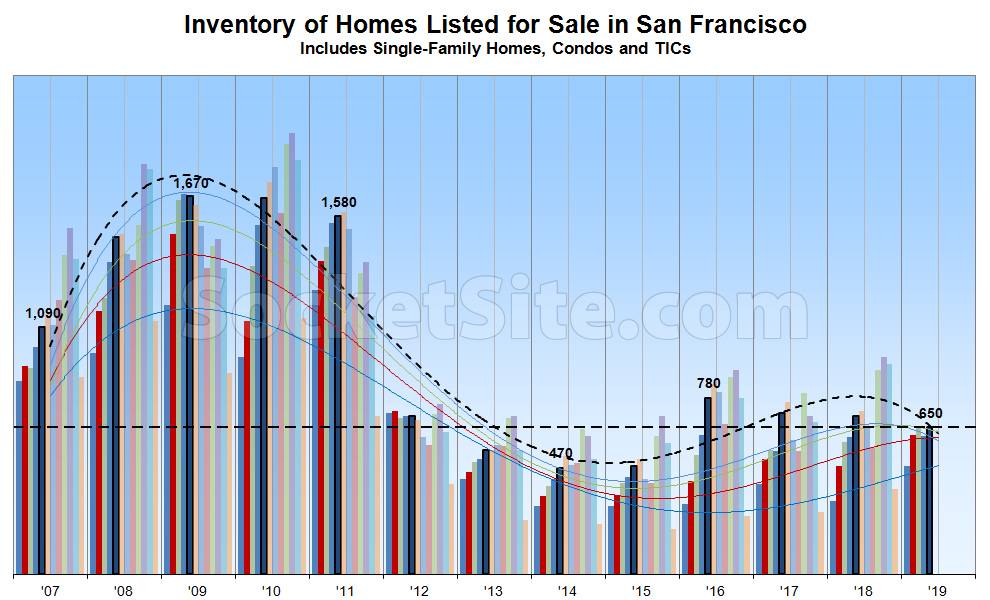
While the inventory of homes actively listed for sale in San Francisco inched up another 2 percent over the past week to 650, which is 38 percent higher than in mid-May of 2014, inventory levels are now running 7 percent lower than at the same time last year, which is the second straight week of year-over-year declines.
The relative drop in inventory levels has been driven in part by an uptick in sales activity, the pace of which has actually started to slow, along with a rather by a significant slowdown in new listing activity over the past two weeks, trends that could quickly reverse.
The percentage of listings in San Francisco which have undergone at least one price reduction has actually ticked up to 14 percent, which is 2 percentage higher than at the same time last year, while the percentage of homes on the market with price tags of a million or more is hovering around 27 percent, which is 5 percentage points higher than at the same time last year.
And yes, we’re still expecting inventory levels to continue to climb through June in San Francisco, at least in the absolute, followed by a summertime lull and peak in the fall.
Thanks for fixing the smoothing. It tells a rather different story now.
We didn’t “fix” anything. The trend simply changed. And with it, the trend lines as well. As always, our story is based on actual data versus a “feeling” of the trends at hand.
Speaking of which, an important sentence from above: “The relative drop in inventory levels has been driven in part by an uptick in sales activity, the pace of which has actually started to slow, along with a rather by a significant slowdown in new listing activity over the past two weeks, trends that could quickly reverse.”
And we’ll add, the drop in inventory levels is NOT being driven by people “withdrawing their properties” in anticipation of a bolus of IPOs.
If you compare to last month’s version of this chart, the shape of the smoothing around 2008 and 2009 is different. That’s not due to a recent trend change.
As your new graph shows, the trend change actually happened four months ago, at which point commenters were already raising suspicions about the graph. If you had been less secretive and obstinate about this, you would have seen that change when it happened.
“the drop in inventory levels is NOT being driven by people “withdrawing their properties” in anticipation of a bolus of IPOs.”
Out of curiosity, how do you determine that from the data you have available?
We not only track inventory levels, but listing and sales activity as well. In other words, we not only know how inventory levels are changing but what’s driving said change as well.
” In other words, we not only know how inventory levels are changing but what’s driving said change as well.”
This is beyond regular mind reading – SS knows what the sellers intentions are before they know it themselves – and if the sellers can’t make up their mind, SS will use inception! 😉
No. But we can isolate what’s driving the change in inventory levels, in terms of sales (yes) versus listings (more) versus withdrawals (nope).
Your bars look like data, but over the past 5 years I’ve never heard an explanation of the “trend” lines. Maybe I missed it, but a legend or description of methodology could be a lot more prominent.
Unrelated, it wasn’t long ago that people were touting $120B as the target for Uber’s IPO- including that ridiculous NYT article quoting r/e agents. Today, after two days and what was supposed to be a conservative launch, it closed with a market cap of $62.5B approaching half of what was expected not long ago and below the Series F and G valuations. Meanwhile, Lyft is down by about 1/3 from its IPO price. Early days, but stilll…
The breakeven number for Uber is $48.77 (see name link). That’s what Uber shares have been valued at since 2015. RSUs granted would have been subtracted from salary at that level. Someone who could have earned $150K would have taken $100K in salary plus 1000 RSUs. The stock price has to be at $48.77 just for the employees to get their forgone salaries back. The stock has settled at $38, but shorting hasn’t started in earnest yet.
Lyft took two weeks for enough shorts to drive the price from $76 to $48. If the same thing happens here, Uber will be in the 20s with employees needing twice that just to break even, and I’d expect it to fall further when the lockup expires.
And this is with the underwriters going all out trying to prop up the stock: “Uber’s underwriters, led by Morgan Stanley, were so worried the company’s initial public offering had run into trouble, they deployed a nuclear option ahead of the deal last week, so they could provide extra support for the stock, four people with knowledge of the move said.”
“Someone who could have earned $150K would have taken $100K in salary plus 1000 RSUs. ”
Quite an assertion. I don’t claim to know everything, but I’m a hiring manager in the industry and this doesn’t ring true. RSUs are usually on top of a generous base. Employees do consider them part of total comp, but they often make up about the same size of total comp for companies like Uber (there’s few places you could go to get more base instead of RSUs outside of maybe netflix, who doesn’t do equity).
Pinterest, the only of the IPO unicorns to have profits, just announced earnings, and promptly fell 15% after hours. Not much higher than their 2017 valuation. Ooops. So it’s basically a SF Trifecta.
Nvidia, noted as a traditional driver of SF real estate previously, announced earnings, and is back to its 2017 valuation as well. RSUs issued in 2H 2017 through 2018, all lost money for the employees.
That’s not really how RSUs work. They are basically cash. Yes, they are less valuable than they seemed two years ago, but these aren’t ISOs where they can be worthless or even worse than worthless.
But because they are cash, you give up your salary for RSUs. Someone who could have earned $150K can take it in $100K in cash and $50K in RSUs. You might do that every year for 4 years, like Uber. If your RSUs from each year fall to $25K, yes, they are worth $100K, but you had to give up $200K to get them, putting you further behind.
In the case of options, an option to purchase Uber stock for $48.77 when the stock was at $48.77 was typically traded for very little cash, because an option to buy something for its market price is worth very little. Yes, if the price of Uber falls to 41, options are worth zero, but you still had the $200,000 in salary that the RSU holder had to give up.
When the stock underlying RSUs goes down, it hits hard because of taxes. They usually take 35 of your RSUs when they vest, to pay for taxes. So someone with $200K in uber RSUs only gets $130K because of taxes. Then if the price falls from $48.77 to 41.80, they are worth $111K. If they fall another 10% due to the lockup expiration, you’re down to $100K for a stock for which you paid $200K.
So the fact that there are X thousand people like this about to hit the market in this position is meaningless when the other 500,000 people who did not take Uber stock all have more money than they do. They aren’t going to bid housing prices up, when they have less money than the other buyers.
You keep on positing worst case hypothetical scenarios and then arguing from that standpoint. As if that’s a worthwhile thing to do, or something. Pretty weird stuff.
Nobody in tech is making numbers anywhere near that tiny. Median Googler makes $550k cash+RSUs in their 4th year. Check levels.fyi for other base salary and full comp comparisons across the industry.
“Median Googler makes $550k cash+RSUs in their 4th year”
4 years would be closer to a L4 (https://www.levels.fyi/salary/Google/SE/L4/): $250K total comp ($150K cash / $100K stock/bonus). Stock would vest over 4 years. Average for non-engineers would be less.
Nope. And 1/2 make less than the median.
@OC: My scenarios are not worst case. The price of Uber stock for the last 4 years has been steady at 48.77. The current price is 41.80. Lockup expiration drops of 10% are pretty normal.
@Jeffrey, the median is a function of cash compensation and the value of the RSUs when they vest. Look at FB, which was at $68 per share 5 years ago. Someone who was being paid $100K+50K/yr in RSUs who started 5 years ago, ended up with $120K (from raises)+150K in RSUs in a single year, because the share price tripled from when they started, so the $50K in RSUs granted actually resulted in payment last year of $150K worth of shares. That’s how someone being paid $150K can net $270K, which is how you end up with their true median of $240K (because not everyone started 5 years ago).
“Someone who could have earned $150K can take it in $100K in cash and $50K in RSUs.”
Again, this just seems like a very ill informed perspective. There’s no employer out there paying the 150K cash (except, as I mentioned, maybe Netflix). Top comping companies give the majority (or generally half) of that comp in RSUs.
The more likely scenario is that you make 150K total comp (which I assume you’re just using because it’s a round number — 150K is what new college grads get), 50K of which is RSUs, and you could go to other FANG-ish companies and get 150K TC, 50K in RSUs. Yes, you could go to netflix and get 150K cash, but nowhere else has the 150K cash for you.
Folks who worked for Uber were already pretty well comped. The risk they took was that their options weren’t going to be as profitable as the more reliable goog/amazon RSUs. Generally they got _more_ options than goog/amazon would give because of that risk. I’m sure they wish the stock price was higher, but hard to say they’re gonna go broke.
erbot, Talk to your finance guy. Anything of value given to an employee is a compensation cost. And if what is given is has a cash value (RSUs in a public company or one with an active secondary market), then the cost is pretty much the cash value give or take a bit. What ever happens to the value of those RSUs after they are given to the employee is on them.
If you are a $150k engineer that’s your value. Some companies might not have valuable stock and will need to pay that all cash. Some might mix cash and stock.
Jeffrey Baker, thanks for posting your source this time. You’ve quoted that in the past. I agree with AY, though. Those numbers you post are very different (much higher) vs other sources out there, e.g. paysa, quora, forums, etc.
The data from levels.fyi is higher because it is right. The idea that major tech companies are paying $75k base salaries in the Bay Area is ridiculous. Look at this anonymous salary survey of “boot camp” graduates with no university education and no experience. The average base even for these bozos is $116k and very few of the data points are below $100k. Also the reason I cited Google’s “L5” rank is because that’s the median rank at that company.
Keep in mind that based on the levels.fyi data, the average L5 engineer at Google has over 10 years of experience and an average total comp of $353,000 ($176,000 of which is salary). The average L4 has over 5 years of experience with an average salary of $145,000 (and total comp of $254,000).
In fact, the highest compensated L5 in the levels database has a total comp of $453,000, including a base salary of $216,000, and that’s with 24 years of experience, including 11 at Google.
All of which does raise the question, what would lead one to believe that the “Median Googler makes $550k cash+RSUs in their 4th year?”
The median age of the US labor force is 42 years, even in the information and computer systems design industries, according to the BLS. You’d expect something like 15-20 years of experience at the median, depending on time spent in education.
Possibly. But based on the data set you’re quoting, the median is under 10 years at Google (which is one of the more established companies).
You guys are arguing an irrelevant point. Let’s call the total compensation $X. It doesn’t matter what X is. What matters is that if you work for Uber and got part of X in RSUs, and part in cash, if the RSUs go down, you have less than what you’d have if they went up or stayed the same.
So whatever X was, you now ended up being paid LESS than X. It doesn’t matter whether you got 1/3 of X in RSUs or 1/2 of X in RSUs and it doesn’t matter what X is, you ended up with less than X, which was the going rate for compensation when you started.
And if the buyers are poorer than the buyers before them, prices don’t usually rise. All the unicorns have less money than the buyers before them, who came from Facebook, Nvidia, etc, all of whose RSUs went up from about the same total compensation. Their employees all had MORE than X when they went to buy, unlike the unicorns, whose employees now have LESS than X. The unicorns aren’t going to bid prices up. Their employees are poorer.
Wow! Six days ago $41.80 for Uber was a hypothetical worst case. Today it closed at $40.44.
Alternate headline: “Lowest Inventory of Homes for Sale in 4 Years”
Speaking as someone who recently purchased a sub-$1 million resale condo in southern Marin, there has been precious little decent-quality product for sale in that category YTD between Larkspur Landing to the north and Market Street to the north. One unit that I am aware of in southern Marin with a list price in the $800s was overbid by more than $100K.
Correct, and we’re now going on three years of continuing appreciation since socketsite called “top.” At some point, prices really will slide, and they will certainly shout “told you so.”
Of course that’s not what we called, nor even correct with respect to the market, but don’t let that get in the way of a good whinge (or two). Now back to the actual trend(s) at hand…