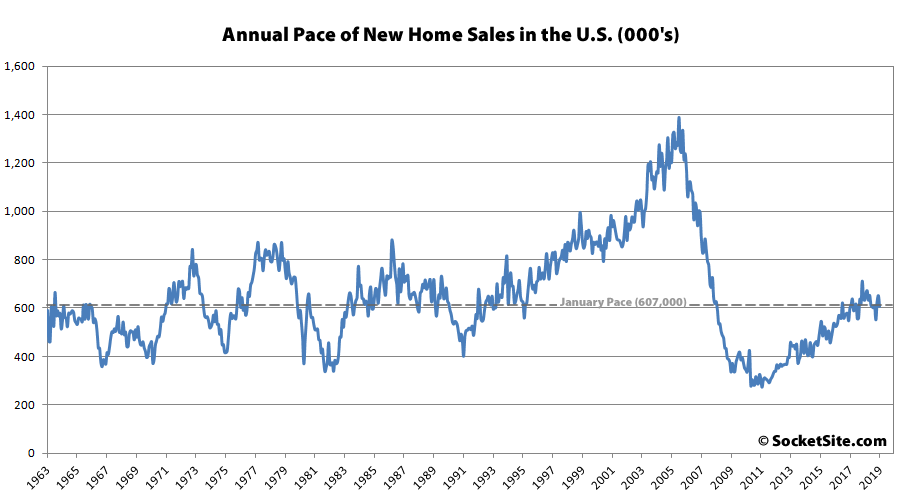
While 2018 ended with the total number of new single-family home sales across the U.S. having ticked up 1.5 percent versus the year before, the pace of new sales was down at the end of the year. And in the first month of 2019, the seasonally adjusted rate of new home sales dropped 6.9 percent to 607,000, down 4.1 percent versus January of 2018.
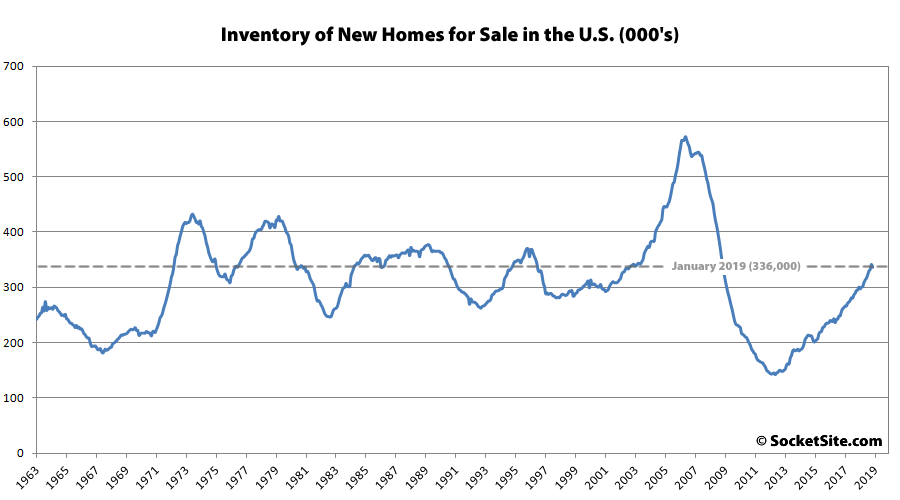
At the same time, while the number of new single-family homes for sale across the county ticked down by 1.5 percent to 346,000 at the end of January, inventory levels remain 13.9 percent higher on a year-over-year basis, representing 6.6 months of supply.
And the median sale price in January was $317,200, down 3.8 percent versus the same time last year with an average sale price of $373,100, which was down 1.2 percent on a year-over-year basis as well.
Out West, the seasonally adjusted pace of new single-family home sales in January (184,000) was down 3.2 percent on a year-over-year basis with 0.5 percent fewer new homes having sold in all of 2018 versus the year before and 21.3 percent more inventory (a total of 91,000 new homes) currently on the market.


New construction starts, however, rose.
Also an interesting embedded video about the costs of California housing which notes that 40% of Chinese purchases of American real estate are located in our state. These international purchases spiked in 2015 and have since receded.
An exogenous increase and then decrease in demand could be borne out by new condo valuations.
A drop in demand and new condo values? Who could have seen that coming!
I guess someone who had good information about the prevalence of Chinese buyers and advanced knowledge about future trade tensions and capital restrictions between China and the US and how that would impact the marginal pricing of condos. Otherwise, no one really knows what absorption rates for new product will be.
If the market is going down now, when will it bottom out? I would love for someone to help me time my next purchase.
Or one could have looked for inflection points in the sales and pricing data and then noted that they were actually trending down, despite what was being proffered, or dismissed, by industry folks at the time (which might sound rather familiar). And if you’re looking for current trend data, here you go!
How far is the market going down? You can see this stuff coming, right?
Is the current sideways (or is it crashing!?!?!) market explained by excess supply? Insufficient demand? Higher rates? Buyer fatigue?
It’s still your site – make it how you want it.
And last month, new construction starts dropped 8.7 percent and are now down nearly 10 percent on a year-over-year basis. New permit activity has dropped as well. But deliveries of newly completed homes (i.e., new inventory) is up.