Based on a comparison of over 2,000 listings in San Francisco proper, including one-off rentals as well as units in larger developments, the weighted average asking rent for an apartment in San Francisco is currently running around $4,250 a month ($3,400 for a one-bedroom), which is 1.9 percent below the weighted average asking rent at the same time last year and 4.7 percent below a peak of around $4,450 in the fourth quarter of 2015. And yes, that’s despite an “end of story” increase in employment over the past year.
That being said, the average asking rent in the city has ticked up around 2 percent since the second quarter of the year with seasonality in play (rents in San Francisco typically rise through the end of summer).
But at the same time last year, rents were running around 1.4 percent higher on a year-over-year basis versus 1.9 percent lower right now.

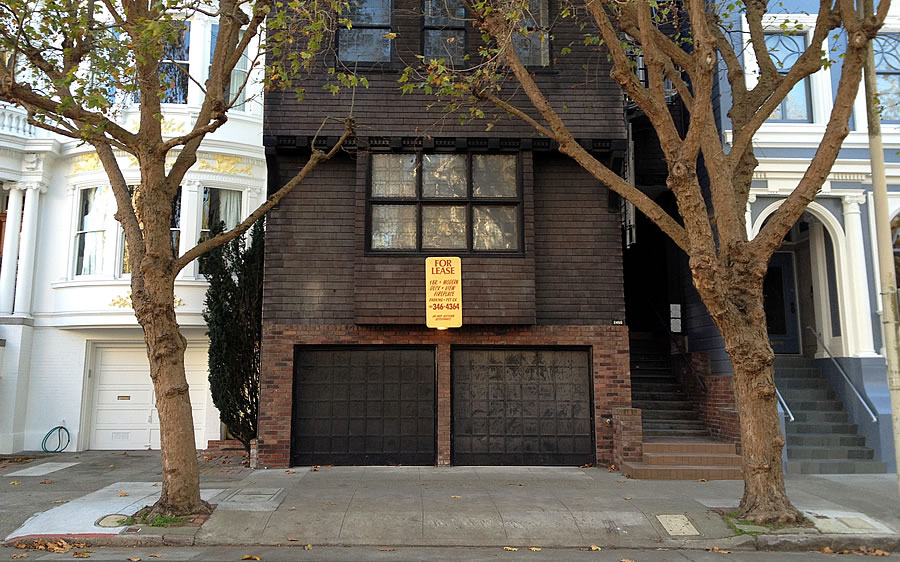
Evey time this image is used I have to crack up as it was one of the first places we looked at renting a long long long time ago. Was a total disaster.
That picture also makes me laugh, Looked at that unit also about ten years ago. This place perpetually had the for rent sign and the available apartment was a complete wreck. I left thinking the landlord was slightly unhinged or running a scam.
Couple of anecdotes: a pro property manager with 30 years in the city told me this summer he’s getting 4 or 5 people showing up at his listings lately. Can’t figure out why. I took an ~11% haircut on my rental from last summer to this.
PanhandlePro: What does the property manager anecdote indicate? Is 4 or 5 people showing up at listings good, bad, or neutral?
“4 or 5” people sounds like very few to me – not long ago there would be lines out the door for open houses. I’m not a landlord though, so maybe I’m misreading something here?
Anecdote: I just re-rented a place for the same rent as I got 16mo. ago for it.
Jackson between Fillmore and Steiner
Did I miss link to the source for this post? (And, is there any dispute that Apartment List has the best index for measuring over-time changes in rent, controlling for mix?)
The source of the trend analysis above is SocketSite, not Apartment List. (Speaking of which, if you think the median price for a one-bedroom in San Francisco proper is really $2,430 a month, as quoted by Apartment List, we would strongly suggest a basic reality check and subsequent smell test as to the quality of any indexing based on said methodology and result.)
No, I think the Apartment List methodology terrible for medians. Their baseline rent figures are from Census data, and thus reflect the median rent across the universe of all apartments in SF (rent-controlled and unregulated alike). As the vast majority of units are rent-controlled, the median rent per Apartment List is probably a lot closer to the median rent currently paid by a tenant under rent control, than the median rent for a unit on the market.
Apartment List takes the median rent from the Census and inflates it up or down based on year-over-year changes in asking rents for units that have been advertised for rent in both years. That is, the adjustment reflects apples-to-apples changes in asking rents, like Case-Shiller. To my knowledge, no other rental index is based on price changes for exactly the same units.
So I think the Apartment List index probably give the most insight of any index about year-over-year changes in the rental market, even though the baseline is way off.
That said, I am concerned that the Apartment List index seems to be based on asking rent, rather than actual rent (contra Case-Shiller, which uses actual sale prices). Particularly in SF and other cities with rent control, asking rent may diverge from real effective rent during down-cycles, when landlords often offer “one month free” as an inducement to get tenants to sign leases at an above-market monthly rate.