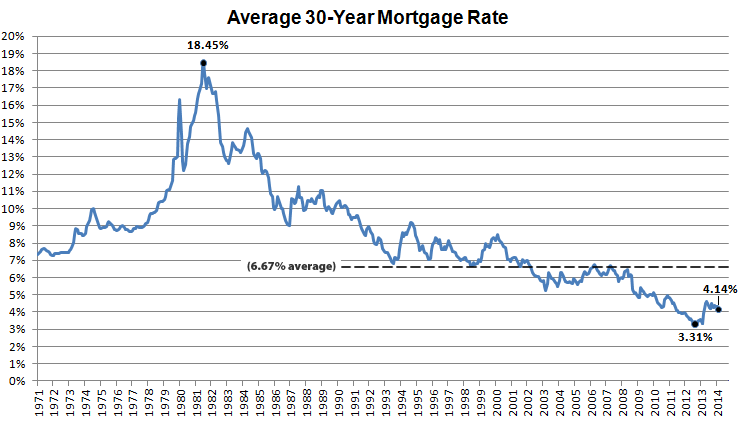
The average rate for a conforming 30-year mortgage ticked down from 4.20 to 4.14 percent over the past week, the lowest rate in seven months and 44 basis points below the three-year high rate of 4.58 percent recorded this past August.
Having averaged 6.67 percent since 1990, the average rate for a 30-year fixed mortgage was 3.59 percent at this time last year. The all-time low of 3.31 percent was recorded in November of 2012.
We’re expecting the rate to tick up over the next week in response to the Fed’s latest meeting notes and Freddie Mac is forecasting the 30-year rate will hit “around 4.6 percent” by the end of the year.

“likely headed up”. That’s what most have been saying for a while now, but 2014 has been mostly down, and my guess is they won’t be going very far in either direction for years to come. 4.6% by year’s end? Maybe, but then don’t be surprised to see them right back at today’s rate 6 months after that. Your historic chart is just that – history.
Great example of an average that doesn’t tell much about the distribution. Notice that the floor on the rate before 2002 has been around the ceiling on the rate since 2002.
FWIW, for the US 30-year fixed rate monthly average from 1971 to 2001, every month since July 2002 (6.49%) has been lower than every month before then back to 1971 (FreddieMac).
Anyone have an explanation for why US 30-year mortgage interest rates for the past decade plus have been lower than for the previous 30 years plus?