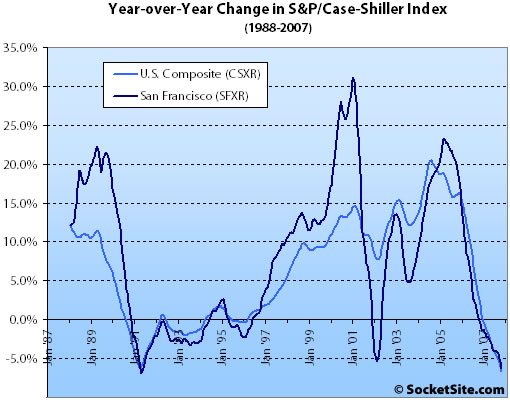
According to the October 2007 S&P/Case-Shiller Home Price Index (pdf), single-family home prices in the San Francisco MSA fell 2.1% from September ’07 to October ’07 and are down 6.2% year-over-year. For the broader 10-City composite (CSXR), year-over-year price growth is down 6.7% (having fallen 1.4% from September).
Miami surpassed Tampa in October, reporting a double-digit annual decline of 12.4%. Tampa followed with -11.8%, Detroit with -11.2% and San Diego with -11.1%. Six of the metro areas are now posting double digit declines in their annual growth rates. Atlanta and Dallas finally entered negative territory, with declines of 0.7% and 0.1%, respectively, leaving only Charlotte, Portland and Seattle as the MSAs still experiencing positive annual growth rates.
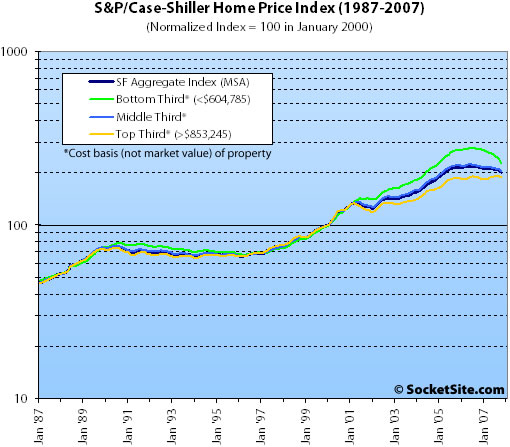
Prices fell across all three price tiers for the San Francisco MSA.

The bottom third (under $604,785 at the time of acquisition) fell 5.3% from September to October (down 17.0% YOY); the middle third fell 2.2% from September to October (down 7.2% YOY); and the top third (over $853,245 at the time of acquisition) fell 1.2% from September to October (up 0.8% YOY).
The standard SocketSite S&P/Case-Shiller footnote: The HPI only tracks single-family homes (not condominiums which represent half the transactions in San Francisco), is imperfect in factoring out changes in property values due to improvements versus actual market appreciation (although they try their best), and includes San Francisco, San Mateo, Marin, Contra Costa, and Alameda in the “San Francisco” index (i.e., the greater MSA).
∙ Broadbased, Record Declines in Home Prices in October [Standard&Poor’s]
∙ September S&P/Case-Shiller: San Francisco MSA And Price Tiers Fall [SocketSite]
Any way to get a scale on that? Looks logarithmic and that may no longer be necessary:)
I wish they had condo prices altho usually those prices fall more then single family.
“SF is Different and special blah blah blah”
“The bottom third (under $604,785 at the time of acquisition) fell 5.3% from September to October (down 17.0% YOY)”
So, folks who purchased a 600k 1-bedroom shack condo(condos probably worse off than low tier homes in this data) with cheap carpeting and drywall interiors in foggy outer richmond with no parking or Washer/Dryer have now lost slightly over $100,000 in equity while being stuck paying 1.5-2x the equivalent monthly rent in mortgage/interest/insurance/taxes on an asset with ongoing depreciation
No wonder Bernanke is scared and the EU Central bank pumped half a trillion ($500,000,000,000) into their system last week
So just to say up front I’ve been a SFO housing bear for a while. Back when prices were still rising I blogged here we could see a 15% to 20% decline. But I looked at this data..and got the raw stuff from S&P. Say if you look at the upper tier. Assume a 7% nominal increase to end of year 2008 so 1.07^7 =172. Well the index in October is all the way down to 188. That’s really only another 10 points (2-3 of which may have already happened in Nov/Dec) before it starts looking reasonable. Maybe I have done some math wrong. I have always been bad at getting formulas wrong, mixing/matching
What interests me is how the upper end seems ‘teflon-coated.’ The last time I remember the market being this shaky (in the early 90s), it was the entry-level market (districts 4 and 10 houses and condos in all neighborhoods) that remained relatively robust. Now it seems to be the other way around.
I know. . . the rich get richer and the poor get poorer.
Cooper: I think the traditional paradigm about condos rising in value last and dropping in value first should be questioned at this point. This observation was based on historical data prior to the mid 1980’s where condos were a very small portion of the housing stock and were generally marginal construction quality in marginal locations. In the last 25 years there has been a huge construction boom of high quality condos in good locations. Not only are the condos better quality and in better locations, but they are such a large part of the overall market now that they are not the unusual/pioneering housing investment that they used to be. I don’t think you’re going to see that big difference in appreciation/depreciation anymore between houses and condos, but hey, that’s just my $0.02.
Cece,
If you look at the raw data while the lower end got hit earlier, it looks like the upper end is catching up fast. And if I’m reading it correctly, the lower end actually appreciated more int he last 8 years than the upper tier did.
cooper, the low end went out of line, and what’s exactly why it is coming back to earth. Top tier is dropping a little bit but pretty much flat.
Cece, in the last bubble, in LA, the high end came down first, then recovered first.
People relax: 525 Laidley Sells For Over Asking!
All is well with SF RE.
Happy Holidays!
From September, to October? Haven’t we seen this before?
Fluj, I don’t think so. Not even 1990 or 1991 saw a Sept-Oct CSI drop that was this steep. What did you have in mind?
I thought we already discussed the October stats. And when you say “September to October” you actually are saying “September.”
I’m confused. Plus, these number do not match what the MLS shows.
Never mind. YOY. Got it.
By the way, if you look at the SF numbers only for SFRs it’s more of what we have been seeing all quarter namely volume down, median up. And if you factor in condos it is a difference of only 32 sales. In fact, YOY ’07 to ’06 CONDO sales saw a big spike in sale price and a small increase in volume.