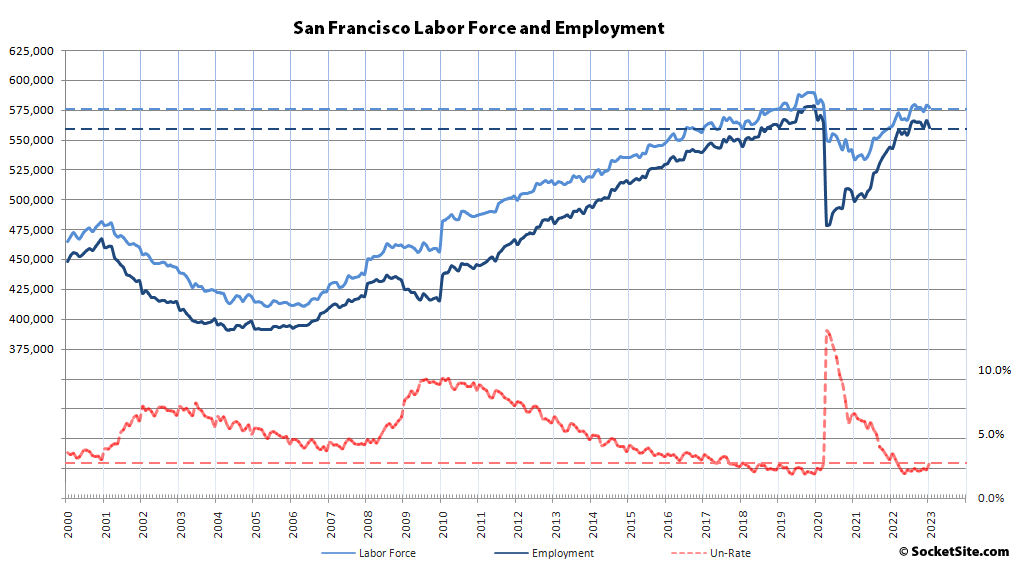
Having ended 2022 nearing its pre-pandemic peak, the net number of people living in San Francisco with a paycheck dropped by 5,400 in January to 560,600 as the impact of tech layoffs and new unemployment claims started to be realized, based on updated data from the State.
That being said, there were still 17,900 more employed residents in San Francisco than there were at the same time last year and 81,900 more employed than there were in April of 2020, when the pandemic-driven unemployment rate peaked at 13.0 percent, but over 10,000 fewer employed residents than there were prior to the pandemic with 7,000 fewer people in the labor force (576,800).
Following suit, the number of East Bay residents with a paycheck dropped by 24,900 in January to 1,513,400, which does represent nearly 61,000 more employed residents than at the same time last year, and 210,000 more employed than in April of 2020, but 46,000 fewer employed residents than prior to the pandemic with 35,000 fewer people in the labor force.
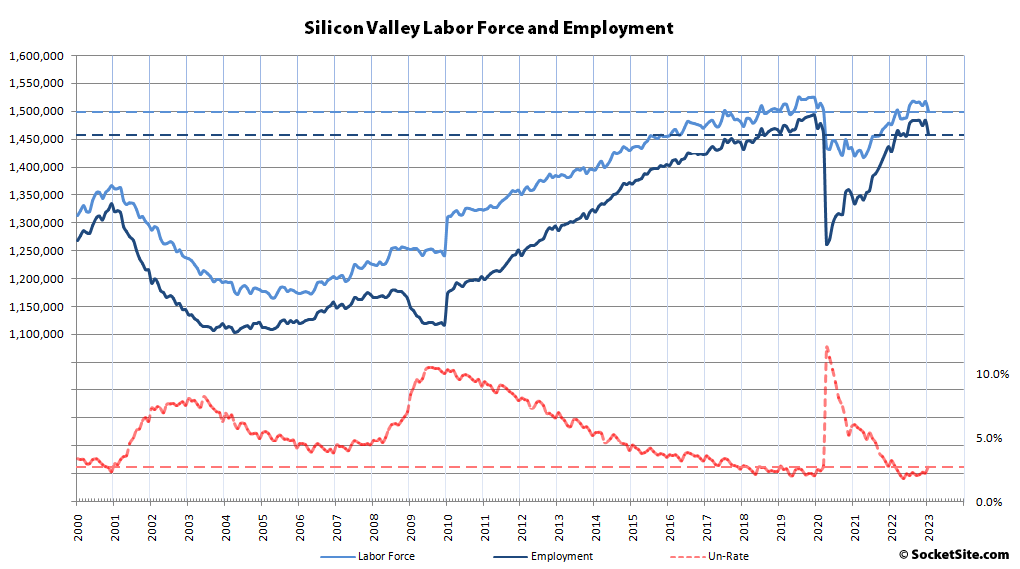
The number of employed residents spread across San Mateo and Santa Clara Counties dropped by 26,000 in January. And while there were still 26,000 more employed people in Silicon Valley than there were at the same time last year, employment dropped back below pre-pandemic levels, by nearly 21,000 people with over 14,000 fewer people in the labor force.
Net employment across Marin, Napa and Sonoma counties dropped by 4,300 in January to 434,200, with 15,700 more employed residents spread across the northern counties than there were at the same time last year but nearly 20,000 fewer than there were prior to the pandemic and over 16,000 fewer people in the combined labor force (449,900).
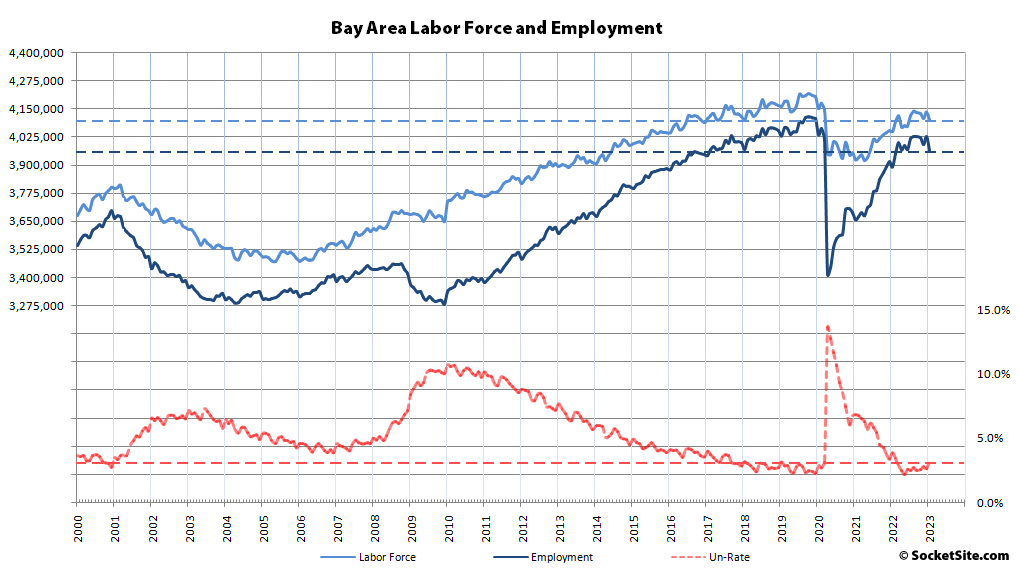
As such, the net number of Bay Area residents with a job dropped by 60,600 in January to 3,965,500, representing 74,000 more employed people than at the same time last year and over 550,000 more employed residents since the second quarter of 2020, but with 96,600 fewer employed residents than there were prior to the pandemic, 73,300 fewer people in the labor force and additional mass layoffs, which have yet to hit the unemployment rolls, in the works and the overall unemployment rate having ticked up to 3.3 percent (from 2.6 percent at the end of last year and 2.2 percent last May).
I’d like to see a chart showing how many metro areas in the US and the world achieved the same raw job growth the Bay Area had from 2010 through 2020. (Which obviously had some negative effects re: housing and traffic) I’m amazed we are still 700k jobs above 2010. Any doomsaying needs to be viewed in this context.
And we’re still 4M abobe 1800!!
But I’d def like to see more discussuion on this point
Which obviously had some negative effects re: housing and traffic)
Of course this is a RE forumn, so maybe one’s hopes should be addresed elsewhere.