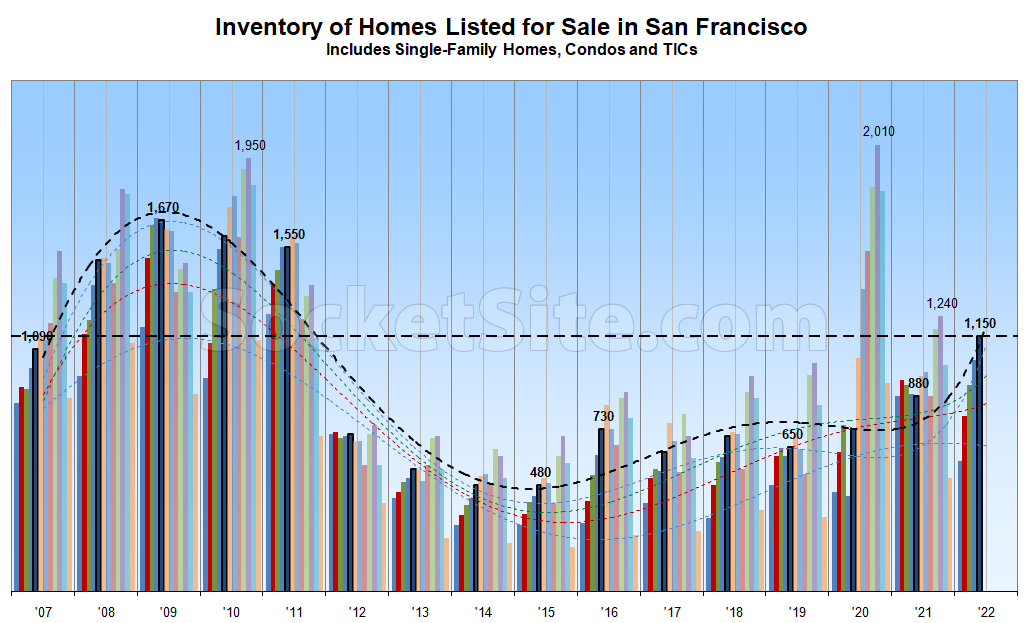
Driven by a pronounced slowdown in the pace of sales, the net number of homes on the market in San Francisco (i.e., listed inventory) ticked up another 8 percent over the past week from what was already an 11-year seasonal high.
As such, there are now 30 percent more homes on the market than there were at this time last year, nearly 80 percent more than there were prior to the pandemic, and nearly 140 percent more than there were in early May of 2015.
At the same time, the percentage of active listings that have been reduced at least once ticked up another percentage point to 24 percent, which is 3 points higher than at the same time last year and versus closer to 13 percent in early May of 2019, prior to the pandemic.
Keep in mind that springtime inventory levels in San Francisco typically don’t peak until June. We’ll keep you posted and plugged-in.
How are there 24% of active listings with a price decrease when homes routinely sell for $400k over the asking price all over the bay area?
Asking price is an arbitrary starting point in the price discovery process.
I don’t follow. Doesn’t a price decrease signify that a home will not go over the pre-decrease asking price?
Some listings are made at the high end of the perceived price range, either hoping an eager buyer will come along or planning to haggle down somewhat.
Other listings are priced way too low, in order to gain attention and to try to create a multiple-bidder situation.
So, you could have some number of houses selling well over the asking price and others being reduced.
Sellers and agents can make very conscious choices about whether to price high or low.
Considering how the job center and other aspects of SF have suffered, it stands to reason that the eager-buyer scenario doesn’t play out as much as elsewhere in the Bay Area, if at all.
No. If you (or your agent) is playing the under-listing game and you expect your home to go for $1.4M then you might list it at $1M. The theory is that this can incite a bidding war and the agent gets to report a huge “over asking” sale.
If no one comes in and meets your $1.4M reserve price, you might re-list at 900k to indicate that you’ve lowered your expectations a bit. You’re still playing the under-listing game though and would never actually accept an offer at 900k.
Some people and agents don’t play this game and just list at their perception of a realistic market price. If the market is cooler then expected they then reduce.
People’s choice of listing strategy is a different thing than changes in market temp.
Some people do flip flop around, they might try the under list thing, then relist at market, then chase the market down… But in my opinion this just looks weird and desperate.
Thank you for the reply! This makes sense.
I’m curious about the source of your numbers. We measure total active listings (single family, condos, TICs) at the beginning of each month from the San Francisco MLS and our numbers at the beginning of April were 937 active listings and 1,080 at the beginning of May, both well below the 1,150 shown above.
That’s pretty consistent with the post, no? If your data is a week old and SS is saying it went up 8% over the last week to 1150, and 1080*1.08=1164, what is the mystery?
I wish this was broken out to SFH and condo/TIC. There has been a bunch of new units made, with part of the thought being to have more units for sale. There haven’t been hardly any new SFH made so how does that chart look for inventory. Also, with the stories coming out about thousands of low income rental units vacant, it would be interesting to know what amount of inclusionary units are for sale and how that number has changed over time.