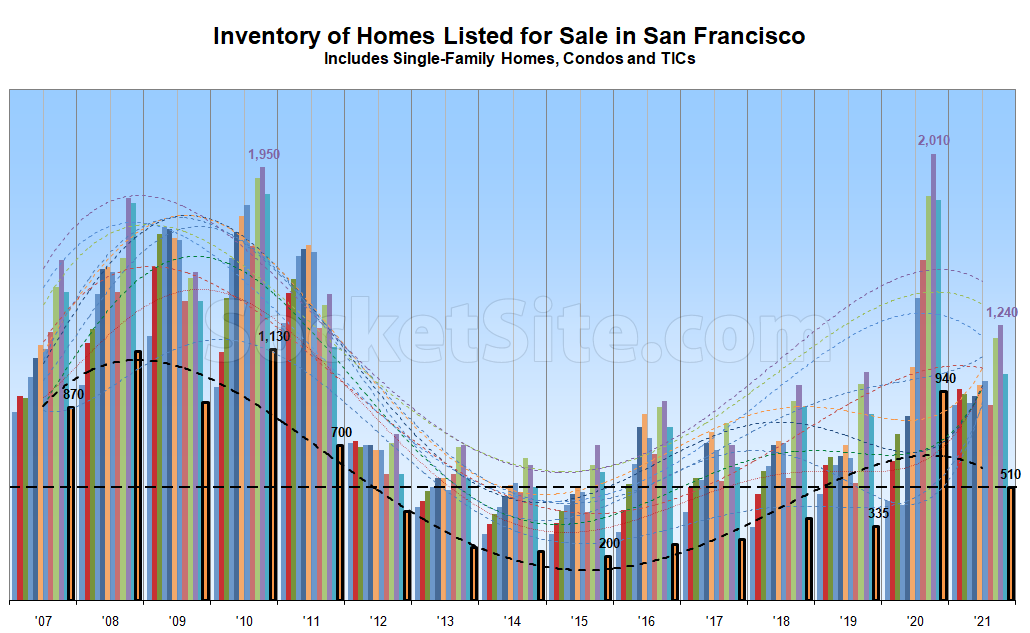
Having peaked in October, the net number of homes on the market in San Francisco (510) has since dropped nearly 60 percent and listed inventory levels are 46 percent lower than at the end of 2020.
That being said, inventory levels in San Francisco are 50 percent higher than they were prior to the pandemic, 150 percent higher than they were in 2015 and at their penultimate high over the past decade. In addition, the drop in inventory levels over the past month has been driven by a drop in new listing activity, not a spike in sales, and pending sales are currently down 25 percent, year-over-year.
Despite some misanalysis making the rounds, seasonality is still a thing in the San Francisco market. And inventory levels should start ticking up in January and then jump in February/March, as new listing activity picks up and properties that failed to sell in 2021 and were quietly withdrawn from the market are re-listed as “new” in the spring.
Best wishes for the new year. We’ll keep you posted and plugged-in.

As outlined above, the drop in listed inventory levels in San Francisco over the past month has been driven by a drop in new listing activity, not a spike in sales. And in fact, pending sales activity in San Francisco dropped to an 18-month low at the end of the year.
Can you provide this chart going further back? Is there (or was there) such a thing as a ‘normal’ level of inventory? Was 2012-2019 an aberration?