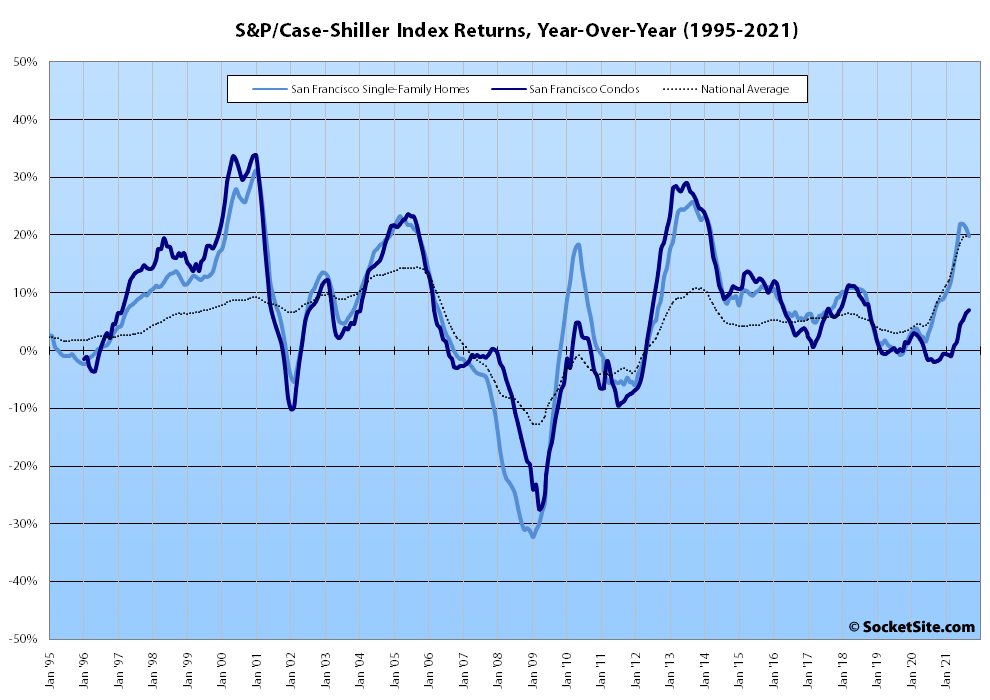
Having inched up 0.4 percent in August, the S&P CoreLogic Case-Shiller Index for single-family home values within the San Francisco Metropolitan Area – which includes the East Bay, North Bay and Peninsula – inched up 0.1 percent in September versus a 1.4 percent gain at the same time last year and the year-over-year gain, which has dropped 2.1 percentage points since July, slipped from 21.3 to 19.8 percent.
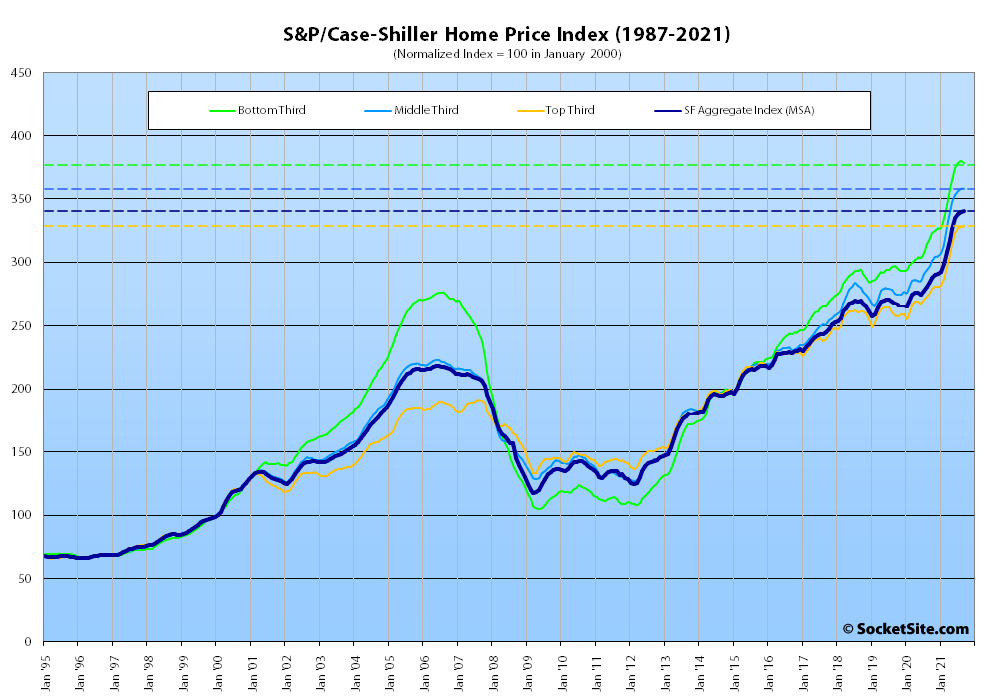
At a more granular level, the index for the least expensive third of the Bay Area market actually slipped 0.3 percent in September, representing the first decline since the fourth quarter of 2019, and its year-over-year gain dropped from 20.9 to 18.6 percent; the index for the middle tier of the market was unchanged from August to September and its year-over-year gain slipped from 21.9 to 20.5 percent; and the index for the top third of the market inched up 0.4 percent for a year-over-year gain of 19.3 percent, down from 20.2 percent in August.
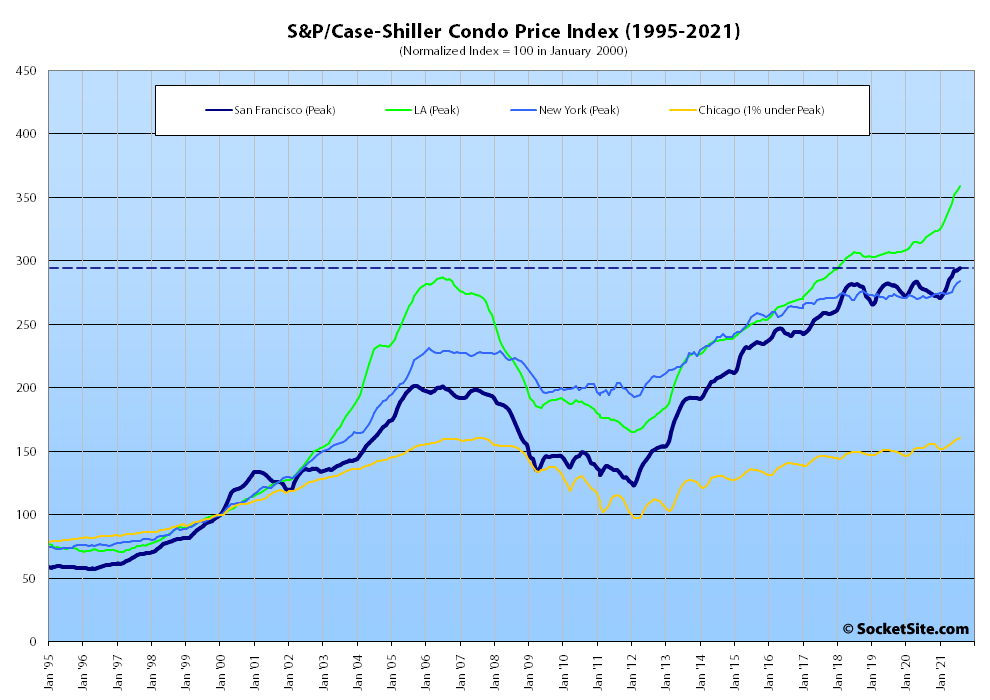
At the same time, the index for Bay Area condo values, which remains a leading indicator for the market as a whole, inched up 0.1 percent from August to September and is up 7.1 percent on a year-over-year basis, versus year-over-year gains of 12.4 percent, 3.1 percent and 5.7 percent in Los Angeles, Chicago and New York respectively.
And nationally, Phoenix still leads the way in terms of indexed home price gains, having increased by 33.1 percent over the past year, now followed by Tampa (up 27.7 percent) and now Miami (up 25.2 percent), with an average indexed gain of 19.5 percent versus 19.8 percent in August.
Our standard SocketSite S&P/Case-Shiller footnote: The S&P/Case-Shiller home price indices include San Francisco, San Mateo, Marin, Contra Costa and Alameda in the “San Francisco” index (i.e., greater MSA) and are imperfect in factoring out changes in property values due to improvements versus appreciation (although they try their best).
This says “the index for Bay Area condo values, which remains a leading indicator for the market as a whole.” What does that mean?
The editor is adding a bit of commentary that condos, since they are traded more actively as assets, rather than long term holds of single family homes, tend to provide more insight into the short term trajectory of the economy.
That’s sort of the opposite of what a leading indicator would be. Obviously, present prices are an indicator of present prices. Anyway, I just don’t understand what this leading indicator comment could mean because the two graphs for condo and house price changes match almost precisely. Neither is a leading indicator of anything.
Great to see condos break out beyond their ceiling of the last few years, especially considering the headwinds they face in terms of remote work and the supposed Bay Area exodus.