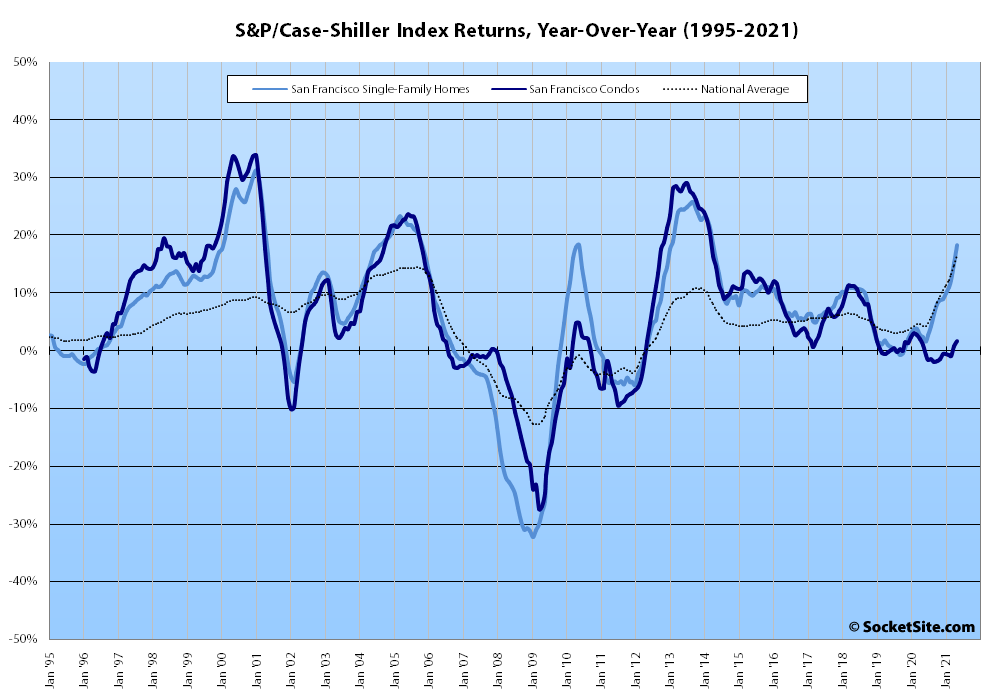
Having gained 3.3 percent in April, the S&P CoreLogic Case-Shiller Index for single-family home values within the San Francisco Metropolitan Area – which includes the East Bay, North Bay and Peninsula – ticked up another 2.6 percent in May and is now up 18.2 percent on a year-over-year basis, which is the largest year-over-year gain for the index since the first quarter of 2014 and above the (record) 16.6 percent gain for the national index.
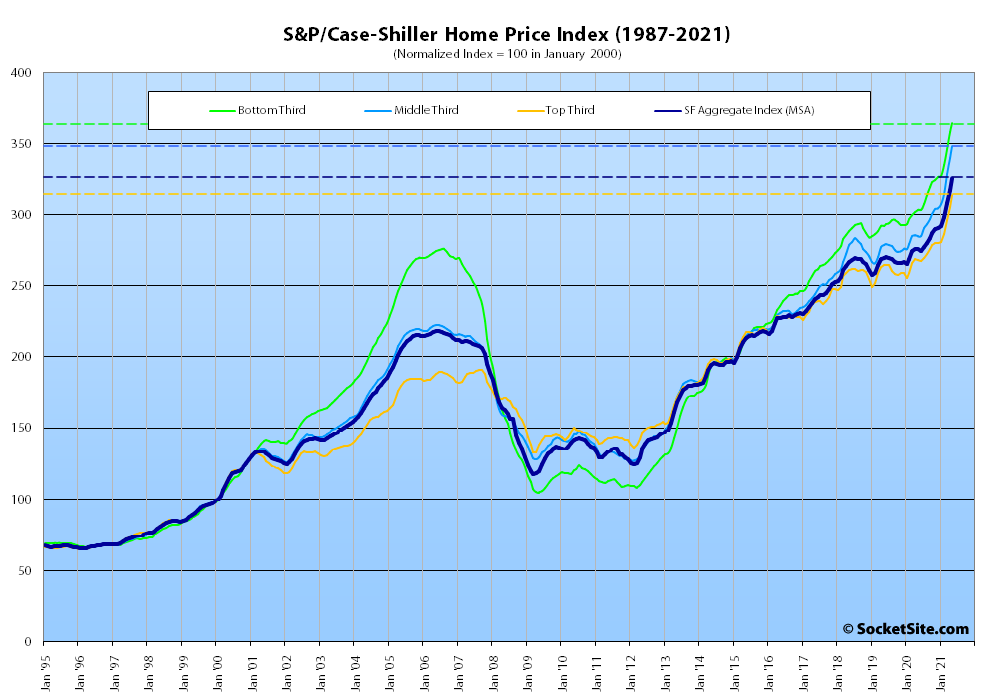
At a more granular level, the index for the least expensive third of the Bay Area market ticked up 1.9 percent in May and is now 20.2 percent higher than at the same time last year; the index for the middle tier of the market ticked up 2.4 percent in May and is now up 22.1 percent, year-over-year; and the index for the top third of the market increased by 2.8 percent for a year-over-year gain of 17.1 percent.
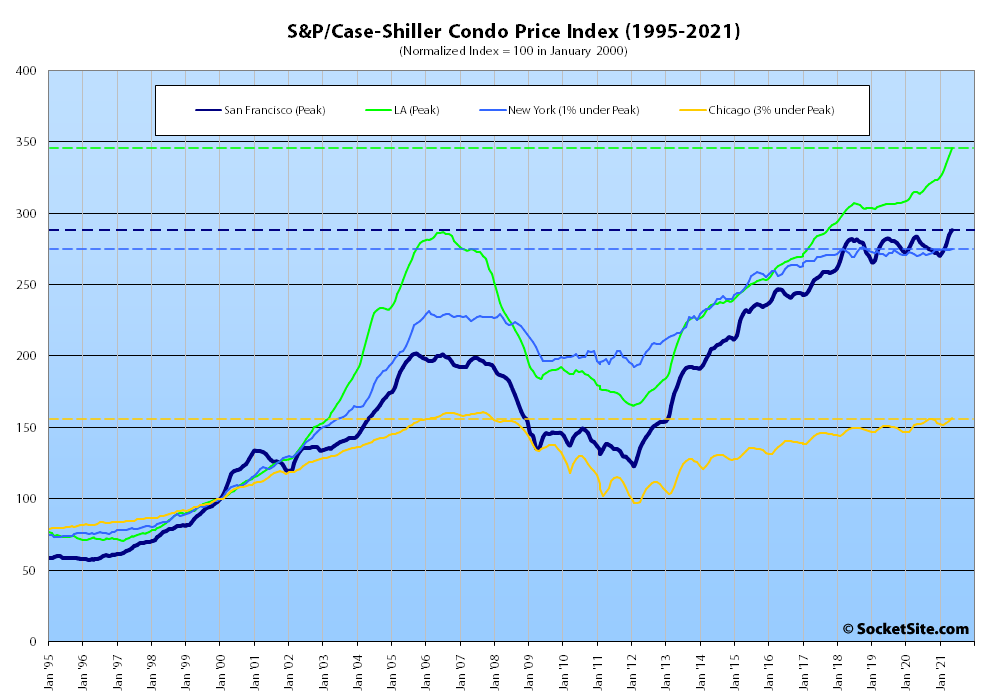
At the same time, the index for Bay Area condo values, which remains a leading indicator for the market at a whole, ticked up 1.1 percent from April to May and is now up 1.6 percent on a year-over-year basis to an all-time high, with year-over-year gains of 9.8 percent, 2.7 percent and 1.8 percent in Los Angeles, Chicago and New York condo values respectively.
And nationally, Phoenix still leads the way in terms of indexed home price gains, having gained 25.9 percent over the past year, followed by San Diego (up 24.7 percent) and Seattle (up 23.4 percent).
Our standard SocketSite S&P/Case-Shiller footnote: The S&P/Case-Shiller home price indices include San Francisco, San Mateo, Marin, Contra Costa and Alameda in the “San Francisco” index (i.e., greater MSA) and are imperfect in factoring out changes in property values due to improvements versus appreciation (although they try their best).
Could have, should have, would have, but did not get chin deep in mortgage debt 6 years ago. Foolishly paid of my modest apartment loan. Should have borrowed a lot more. Now I understand inflation, as I see myself get poorer with each passing day.
For me, the headline is the condo and housing indices are correlating for the first time in a year. My guess is that signals a bottom for condos.
So if there is no C-S for SF City proper, has someone created one from the same dataset? I don’t SFRs here in the city have performed anything like this in last year.
You don’t what SFRs here in the city? The MLS shows 3317 sales 7/27/20 – 7/27/21 at $1039.71/ft . And 07/27/19 – 7/27/20 shows 2377 SFR sales at $1003.63/ft. That’s 3+% higher despite nearly 1000 more sales. If you go back farther in time ’18-’19 shows 2753 sales @ $981.07. And ’17 – ’18 2840 sales @ $961.44, and so on, and so forth. This is an all time record year for SFRs in SF.
Can you share how or where on the MLS you get that information about the price per square foot? I thought the selling price was more like 1100 per square foot.
And do you believe as interest rates rise in 2022 and 2023, this price per square foot may drop?
Thank you.
Sure. Nowadays you just click on the statistics button in the MLS, and a page loads which tabulates all sorts of metrics. I only displayed SFR prices. The 3654 condos sold between 7/27/20 – 7/27/21 averaged $1081/ft. The pandemic hit condo values pretty hard. The 2121 condos sold 7/27/19 – 7/27/20 got $1130/ft.
And as such, the average sale price per square foot in San Francisco has actually slipped.
I don’t know. Previously when interest rates slightly rose, 2004 – 2007, we actually saw dollars per feet price increase in SF.
3-4% was basically inflation over the past year and not even in the same zip code, if you will, as 18%.