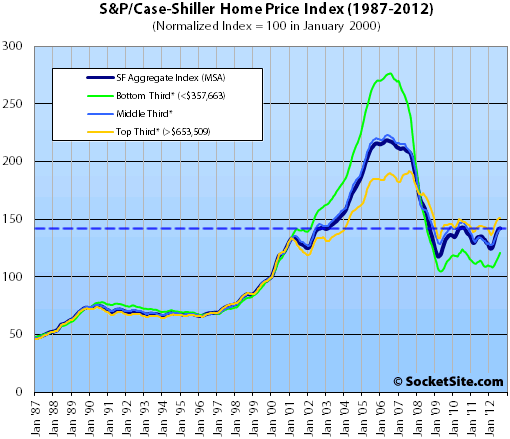
According to the August 2012 S&P/Case-Shiller Home Price Index, single-family home values in the San Francisco MSA gained 0.5% from July 2012 to August 2012 and are up 5.3% year-over-year but remain down 34.8% from a May 2006 peak.
For the broader 10-City composite (CSXR), home values gained 0.8% from July to August, up 1.4% year-over-year but remain down 29.9% from a June 2006 peak.
Nineteen of the 20 cities and both Composites showed monthly gains in August. Seventeen cities and both Composites posted positive annual returns in August 2012. In 18 cities and both Composites annual rates improved in August versus July. Dallas’ rate remained unchanged at +3.6% and Chicago worsened slightly from a -1.0% annual rate in July to a -1.6% annual rate in August.
Phoenix continues to lead the home price recovery. It recorded its fourth consecutive month of double-digit positive annual returns with a +18.8% rate for August. Atlanta posted a -6.1% annual rate, however this is significantly better than the nine consecutive months of double-digit declines it posted from October 2011 through June 2012. Las Vegas’ annual rate finally moved to positive territory with a +0.9% annual rate of change in August 2012, its first since January 2007.
On a month-over-month basis, values rose across all three San Francisco price tiers.

The bottom third (under $357,663 at the time of acquisition) gained 2.6% from July to August (up 7.5% YOY); the middle third gained 0.9% from July to August (up 7.3% YOY); and the top third (over $653,509 at the time of acquisition) gained 0.4% from July to August, up 4.7% year-over-year.
According to the Index, single-family home values for the bottom third of the market in the San Francisco MSA have returned to just below October 2000 levels (down 56% from a peak in August 2006), the middle third has returned to June 2002 levels (down 36% from a peak in May 2006), and the top third has returned to just below May 2004 levels (down 21% from a peak in August 2007).
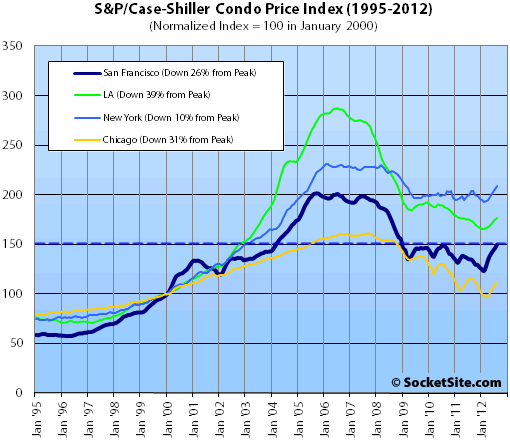
Condo values in the San Francisco MSA gained 2.5% from July to August and are up 11.1% year-over-year but remain 25.6% below their December 2005 peak.

Our standard SocketSite S&P/Case-Shiller footnote: The S&P/Case-Shiller home price indices include San Francisco, San Mateo, Marin, Contra Costa, and Alameda in the “San Francisco” index (i.e., greater MSA) and are imperfect in factoring out changes in property values due to improvements versus appreciation (although they try their best).
∙ S&P/Case-Shiller: Home Prices Continued to Rise in August 2012 [Standard & Poor’s]
∙ San Francisco Home Prices Gain In July, Condos Up 8.1 Percent YOY [SocketSite]
The Great Levitation continues!
Praise be to the Fed’s printing press!
Diemos,
when are yopu expecting us to hit the “50% of everything in SF” stage?
Well you just throw in some inflation adjustments and say it was already done in ’09 in ‘real’ terms…
Let’s say the bears won in 2009. Should we set up a ticker tape parade and move on with our lives?
Take that purrrma-bears! Back to 2000-2004 levels, just a mere 8-12 years ago! Ha! Well, less another 20-30% from inflation. But Ha!
Sorry to rain on the schadenfreude, anon, these are positive graphs but they don’t reflect the drama of what is really going on. For example, there’s a condo I know about that was bought in early 2005 for 500k, and an identical one next to it just sold for 850. My friend rents his out at stratospheric rates. His rate of return is excellent given he only had 100k in the thing. He’s also refinanced it at a low rate. I know of dozens of example like this one. So you can tell yourself that folks have lost a lot of money, but you’re talking theoretics, I’m seeing reality.
[Editor’s Note: Anecdotes are always stronger when accompanied by real addresses, else they’re simply
theoreticalhypothetical.]It must suck to be a perma-bear, breathlessly exclaiming in early 2009 that we are NOWHERE near the bottom – only to get kicked in the nuts for what 40, 42 months now?
^ I see the same things. As an old bear, I see where anon and others are coming from. High prices are very disruptive to many and this can be frustrating. But at some point you have to embrace change and not resist it.
Today I’m kinda bummed out because I had planned to make another investment this year and I just can’t do it at today’s prices without breaking the bank. Glad I bought 2 years ago though. High prices still suck big time for whoever wants to stay reasonable.
I was a bear from about 2004-2005 (don’t remember exactly) until late last year when I bought, felt pretty good to tell you the truth. Missed out on all the pain, and got to get a pretty good deal when things started getting better.
I’m still bearish in some senses, but it’s pretty obvious that they are re-inflating the bubble. Might as well get in at the bottom.
Long term it’s bad for us all, as the next crash will likely be even worse, but for the time being there are opportunities.
The storm back east will have some broad economic consequences I believe on those that were holding onto second homes in beach towns. This will take a few weeks / months to emerge as a theme. Expect building supplies to be shifting towards the east coast as well. This storm will keep plenty of local builders in business for quite some time.
Yes, big disasters generally bring a nice economic uptick as government and insurance money floods in (pun intended). It’s a form of de facto keynsianism. Lots of evidence that the Northridge quake snapped southern california out of the early 90s recession.
Yes, people do dig into their pockets, or use the credit card to rebuild, or let the insurance pay when they can.
When you rebuild, on top of the direct expense there’s usually added value, like that expansion/remodel you always keep pushing off, or better quality or savings (energy, upkeep cost) that trickle into other types of consumption and the rest of economy.
Anyone care to predict when we will break the C-S peak set in 2006? I am going to guess 2018, because Bay Area real estate tends to go up about 7%/yr when it is in one of its growth cycles, like it is now. That is nominal, not real growth.
Notice if you had bought in 2000 and held to today you would have still beaten inflation, though not by too much.
NVJ,
All depends on your neighborhood. I have some friends who purchased a house in NV 13 years ago and for the price they paid they’d be happy to get a TIC 1/2 that size today.
A big clue on how prices are compared with the “top” would be to look at short sales. I haven’t seen many. A quick Trulia search shows eight total.
A sign that not many sellers are losing their shirts.
I doubt we are going to see an average of 7% annual gains over the next 6 years. Yes prices are higher then they were a few years ago and we have bounced off the bottom a bit but I do not expect to see the demand there to sustain increasing prices for years end. Pent up supply still exceeds pent up demand. So as prices start to climb, more places will come on the market which will keep prices from increasing rapidly. Yes certain neighborhoods will do better due to desirability but overall I do not see the inflow of new buyers into the market (banks still are being very tight on lending standards) that can sustain a new bubble.
7% a year is the overall long term nominal rate that SF real estate has gone up, it won’t really require a bubble for us to continue on the trend.
Bubble years are more like 20-30% around here. I don’t expect anything like that, but would not be overly shocked if it happened.
[Editor’s Note: Expectation Setting: San Francisco Appreciation.]
Head and Shoulders pattern until proven different.
gyuppy,
I think you should get your shoulder looked at if it looks like that chart.