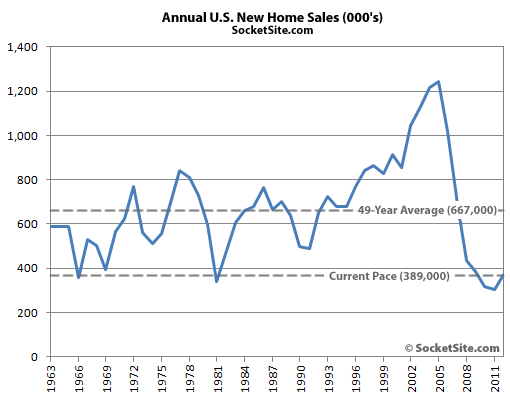
The seasonally adjusted annual pace of new single-family home sales in the U.S. ticked up to 389,000 in September, up 5.7 percent from a revised rate of 368,000 in August and up 27.1 percent versus the 306,000 pace recorded in September 2011, an all-time low.
Annual new home sales in the U.S. have averaged 667,000 since 1963, peaking at 1,283,000 in 2005.
Preliminary U.S. new home sales (versus pace) in September were estimated to be 31,000 (give or take 7 percent), unchanged from August and up from a record September low of 24,000 last year. September sales peaked in 2005 with 99,000 new homes sold.
In the West, the pace of new home sales ticked up 3.9 percent versus August, up 62.1 percent on a year-over-year basis.
∙ New Residential Sales: September 2012 [census.gov]
∙ New U.S. Home Sales Slip In August But Remain Up 27.7% YOY [SocketSite]
∙ New Residential Sales Since 1963 [census.gov]

The graph above illustrates exactly why looking at things for more than quarterly or yearly increments matters. The media headline will be “US home sales surge”. Which is correct, but misleading, given our still very depressed level of development. But it’s good to know that real estate is again contributing to economic growth and employment.
what’s the number for this year?